On June 27th,2023 Volatility Shares introduced BITX, the first 2X leveraged Bitcoin Exchange Traded Fund. This post will review BITX’s architecture, operational characteristics, likely risks, possible rewards, and potential trading strategies. A simulation of BITX back to 2014 provides some data on how this Exchange Traded Fund (ETF) might perform in the future.
Before we get into the specifics of how BITX works, I’m disclosing that I hold a small, minority share in Volatility Shares LLC, the issuer of BITX. Volatility Shares has also issued ZIVB, ETHU, SVIX, and UVIX ETFs. I do not hold management, executive, or operational roles in Volatility Shares LLC, nor do I give recommendations or investment advice to their clients. My analysis of these funds and their associated indexes is my own, is not investment advice, and is based on publicly available information.
BITX is a 2X Leveraged ETF
Architecturally, BITX is structured as a 2X leveraged, daily resetting, exchange-traded fund. Volatility Shares, the issuer of BITX, seeks to have the ETF deliver twice the daily percentage moves of a mix of short-term CME Bitcoin futures.
It’s not surprising that Volatility Shares chose to use Bitcoin futures rather than Bitcoin as the underlying security for BITX. For a long time the US Securities Exchange Commission (SEC) rejected all the applications of proposed USA-based Exchange Traded Funds that directly hold Bitcoin, reportedly at least partially due to concerns about the use of crypto exchanges like Coinbase. The Bitcoin futures used by BITX use the CME exchange, a USA based exchange that has been in operation for over a hundred years that includes a counterparty arrangement that further protects the interests of those holding Bitcoin futures.
I will get into some details later in this post, but unlike some other futures types, the historical daily percentage moves of Bitcoin futures have closely tracked Bitcoin’s moves and this close correspondence is likely to continue.
Specifically, BITX seeks to deliver 2X the daily percentage moves of S&P Global’s SPBTFDUE index. This index documents a process for rolling Bitcoin futures from sooner-to-expire futures to longer-to-expire futures. While this index provides guidance to Volatility Shares for managing BITX’s assets, Volatility Shares does not guarantee that BITX’s mix of futures or performance will exactly track the index. The fund’s official Net Asset Value (NAV) will ultimately be decided by the value of the assets it holds, not by SPBTFDUE’s value.
A BITX Simulation
The long-term performance characteristics of a 2X leveraged ETF holding futures on the notoriously volatile Bitcoin challenges our intuition. One way to inform our intuition is to simulate how this product would have performed in the past. Of course, there is no guarantee that BITX will behave similarly going forward.
S&P Global has computed values for BITX’s tracking index, SPBTFDUE, starting from late 2017, when CME Bitcoin futures started trading. Simulating BITX’s performance from that point forward is straightforward. I extended the simulation back to September 2014 (when a Bitcoin was trading at around $450) by assuming that Bitcoin futures prices, had they existed at that point, would drop at the same average rate relative to spot Bitcoin (~4% annually) as in the 2017 to 2023 period.
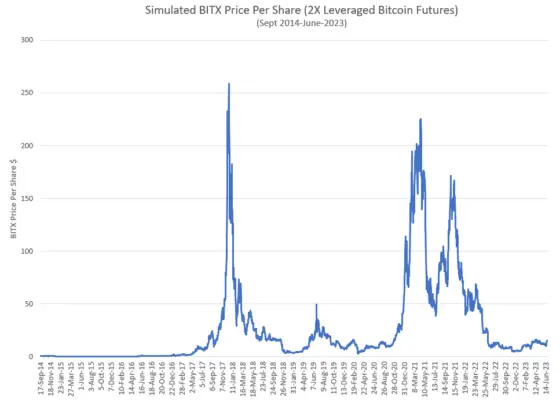
The chart below shows the results of the BITX simulation. The price per share is scaled such that the 26-Jun-2023 price aligns with BITX’s $15 inception price.
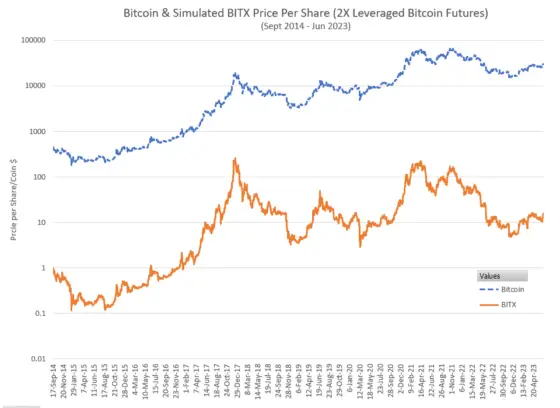
The log-scaled chart below provides visibility into the earlier years and adds a comparison to historical Bitcoin prices.
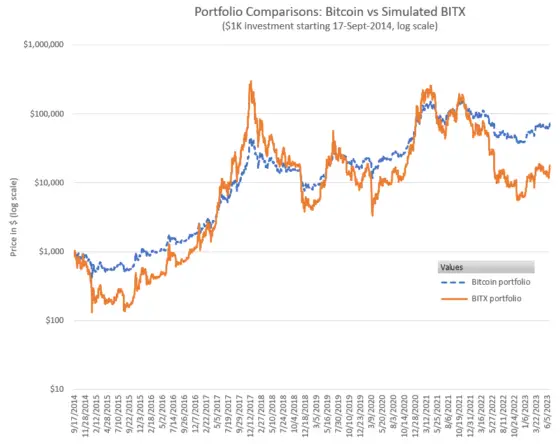
The chart below compares the performance of $1000 invested in Bitcoin vs BITX starting on September 17, 2014.
This BITX backtest simulation spreadsheet is available for free here.
Some Observations on the BITX Backtest
- Despite Bitcoin’s huge price gains from 2014 to 2023 (on average 60%/year) a 2X leverage product would have delivered much less than a 120%/year gain. My simulation suggests around a 37% annual gain. Still impressive, but the associated ups and downs along the way would have made a buy-and-hold strategy an adrenaline-soaked experience with multiple episodes of riches to rags.
- A bad time to buy BITX during the backtest period, was December 18th, 2017. One thousand dollars invested then would, as of June 27, 2023, be worth about $100; an average loss of around 35% per year.
- Unlike some leveraged long ETFs, the backtest suggests BITX won’t be on an inevitable ride to zero. Certainly, the future performance of Bitcoin will be the primary driver in BITX’s performance, but the relatively low carry costs associated with Bitcoin futures suggest that BITX’s cumulative contango losses, which decimate some ETFs funds (e.g., the VIX futures-based VXX, UVIX & UVXY) will be relatively low.
- During Bitcoin upswings the BITX crescendos are very short-lived, a trader long BITX would have to either be lucky or have a very good sense of timing to exit near the peak values.
- The following table summarizes the best and worst-case percentage moves over various periods for Bitcoin (BTC) and BITX starting in January 2019
| 1 Day | 5 Day (Week) | 21 Day (Month) | 93 Day (Quarter) | 252 Day (Year) | |
| BTC Worst Loss | -37% | -45% | -51% | -56% | -77% |
| BITX Worst Loss | -47% | -71% | -81% | -86% | -98% |
| BTC Best Gain | 25% | 41% | 122% (~2.2X) | 427% (~5.3X) | 1053% (~11.5X) |
| BITX Best Gain | 50% | 123% (~2.2X) | 305% (~4X) | 1851% (~19X) | 6153% (~62X) |
The table above shows some of the benefits of BITX’s daily resetting ETF structure. For multi-day periods, BITX’s effective leverage is lower than 2X for down-trending periods, and better than 2X, sometimes dramatically, for up-trending periods. The reason for this is discussed in the next sections.
For single-day moves, BITX’s simulated best-case gain is 2X of the BTC move, as you would expect, but on the worst loss side, the simulated BITX only moved -47% compared to the 37% move of Bitcoin. The worst-case day was March, 12th, 2020, during the worst of the Covid crash. The CME’s bitcoin futures drop was less than the full BTC drop that day, probably because either the USA markets were closed when the drop happened, or the drop was very short-lived.
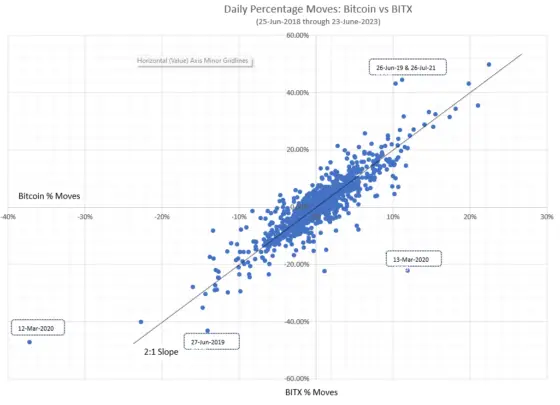
- The scatter chart below shows the per day BTC percentage moves vs BITX’s underlying index moves. The basic correlation is a one-to-two mapping in percentage moves, but it’s a fairly noisy relationship. The limited trading hours of the Bitcoin futures/BITX are probably the biggest cause for the differences. Some of the largest deviations from the 1:2 mapping are labeled with the dates they occurred.
- While BITX only trades during typical USA trading hours, Bitcoin trades continuously. This raises the question of how large the typical Monday moves of BITX will be. At open, Monday mornings, BTC will have been trading for approximately 64 hours (~2.66 days) since the US markets were last open. Standard volatility theory asserts that volatility increases with the square root of time, so it predicts Monday’s volatility will be 1.63 times the normal daily volatility. The chart below shows the simulated close-to-close day-of-week sensitivities.
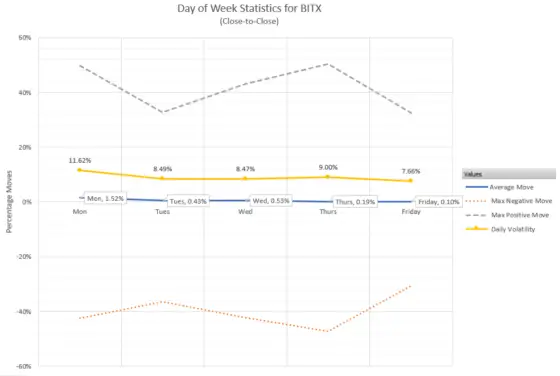
Monday’s daily volatility is 11.6%, a bit higher than the 9% daily average, but well below the predicted 14.7%. Perhaps this shortfall is due to lower volatility during the weekends.
BITX risks:
Not surprisingly, the BITX backtest simulation suggests that a 2X leveraged ETF tied to the notoriously volatile Bitcoin cyber-currency will have a lot of price volatility. Some less obvious risk factors associated with Leveraged ETFs are detailed below.
- Volatility Drag
All leveraged ETFs have a loss mechanism called volatility drag, which reduces returns below what a trader might expect. Volatility drag in leveraged ETFs occurs when daily security prices follow a noisy, up-and-down path. Leveraged ETFs must rebalance their assets at the end of every day to achieve their leverage goals. If the day-to-day price action is noisy, that rebalancing activity ends up generating losses.
Conceptually, a leveraged ETF executes a momentum strategy that assumes that the market will continue in the direction that it moved the current day. If instead, the next day’s movement reverses and the price goes the other direction, the ETF will lose some value. The magnitude of this loss depends on the magnitude of the reversal. For a 2X leveraged product the average daily volatility drag will be approximately the daily volatility of the underlying index squared. The daily volatility of BITX’s underlying index, SPBTFDUE, averages ~4%, so BITX’s volatility drag will be around (.04)^2 = 0.16%. This might not seem like a lot, but over a year, with approximately 250 trading days, the cumulative loss would be (1-.0016)^250 -1 = -0.33, or 33% per year. See this link for more information on volatility drag.
- Big Down Days; Essentially Unrecoverable Losses
Big down days can be treacherous for 2X leveraged ETFs. If the underlying index of a 2X leveraged ETF drops 50% or more in a single day, the ETF’s price will likely drop to zero.
If BITX’s value was to drop to near zero intra-day, the fund’s operators will likely act to dramatically reduce the number of Bitcoin futures it holds. A 2X fund uses leverage to effectively hold $2 of the underlying asset for every $1 invested, so if the futures held by the ETF drop in value by 50% or more during a single day, the losses could equal or exceed the asset value of the fund, leading to an end of day share price at or near zero. In this scenario, the ETF issuer is exposed to huge losses if the underlying continued to drop. To protect itself, the fund would likely sell assets, and/or have hedges in place, to reduce its effective leverage. Somewhat smaller daily losses, e.g., 45% in the underlying, would probably not trigger deleveraging of the fund, but could still inflict grievous (e.g., ~90%) decreases in the 2X ETF’s price per share.
A less obvious risk is that there’s no realistic way to recover from a dramatic full-day drawdown on a 2X ETF, even if the market recovers spectacularly the next day. If BITX is down 90% at market close, a 30% recovery in Bitcoin futures the next day will not help much; only bringing the fund’s value back to 16% of what it was two days before.
A trader positioned for 2X leverage via margin loans rather than a 2X leveraged ETF would do much better in the two-day “down then up” scenario. With the futures down 45% one day and then 30% up the next day scenario, the margin-based trader would only be down 28.5%. However, in the “down then down more” scenario they could lose up to twice their investment, whereas losses in a 2X ETF are limited to the amount invested.
The CME exchange does have general market circuit breakers which are coordinated with the stock markets and in addition, the CME’s cyber currencies futures have their own dynamic circuit breakers.
From a risk management standpoint, it’s prudent to assume that BITX could drop more than 2X Bitcoin’s daily percentage move. So, it’s possible that BITX’s share price could drop to zero, or near zero, even if Bitcoin’s single-day drop was less than 50%. I discuss some ways to mitigate that risk in the trading strategies section below. - Is the Bitcoin Adventure Over?
Bitcoin has had an incredible run-up in price since its inception in 2009. Often the past is a good predictor of the future, but there are no guarantees that Bitcoin’s long-term upward trend will continue. If it doesn’t, that’s bad news for long-term holders of BITX.
BITX Opportunities
- Bitcoin’s Price Goes on Another Run-Up
The BITX backtest shows there’s potential for spectacular gains if Bitcoin goes on a bull run. The BITX simulation shows three periods with huge gains in the last five years, 2017 (100X+), 2019 (14X), and 2020 (22X).
- Multi-day Upward Trends in Bitcoin
Some of BITX’s periodic spectacular simulated performance is due to the flip side of the volatility drag phenomenon that was described in the risks section. As mentioned earlier, a leveraged ETF effectively implements a momentum strategy, and if the underlying does go up for multiple days in a row, then the ETF can outperform relative to its leverage factor. For example, if Bitcoin were to trend up 10% a day for three consecutive days, then BITX’s performance would likely be around 72%, rather than the 60% gain you might expect. For more on this see When Leveraged Funds Outperform Their Leverage.
Fees, Regulatory Status, and Taxes
BITX’s annual fee is 1.85%, which is deducted daily (~0.005%) by Volatility Shares from the fund’s assets. BITX is registered under the US Investment Company Act of 1940. My understanding is that BITX will report gains/losses via IRS 1099 forms, will not issue K-1s, and that BITX is not subject to non-resident withholding on publicly traded partnerships (PTPs). Consult with your tax advisor regarding your specific tax obligations.
Bitcoin futures
When first introduced in late 2017, there was speculation that Bitcoin futures would not closely track Bitcoin’s daily (spot) price, but Bitcoin futures have proved to be a good proxy for Bitcoin. This performance is not surprising given how futures really work. The popular notion of futures is that they are vehicles for wild speculation, subject to huge unpredictable swings. While some futures do have those characteristics, in the five years that bitcoin futures have been trading, they’ve been quite predictable, mostly driven by mundane things like interest rates. This historic performance strongly suggests that futures market makers can cost-effectively hedge their positions with Bitcoin.
Since their inception in 2017, Bitcoin futures with more time until expiration have had higher prices than futures nearer to expiration. This is a term structure condition called contango. Historically, holding Bitcoin futures and rolling them as needed costs around 4% per year relative to just holding Bitcoin directly.
Volatility Shares may change the quantity and mix of Bitcoin futures held by BITX daily. There are at least three drivers for those changes:
- Each trading day the fund rolls some of its soonest-to-expire futures to futures with more time until expiration,
- The flow of cash in and out of the fund,
- To position BITX to deliver 2X leverage the next day. The number of futures held by the ETF will be increased or decreased depending on the current day’s ending percentage move from the previous trading day.
Trading Strategies
Although most holders of BITX will likely be short term traders, some will try to capture a future sustained run-up of Bitcoin prices by just buying and holding. However, even if that strategy is successful, any windfall gains will likely fade quickly away if BITX is held for a long time.
- In practice, identifying the peak value of a Bitcoin rally is virtually impossible, so strategies that take profits as they occur, e.g., selling shares to cash out ten percent of the profit every week, are attractive approaches that don’t require the trader to pick the peak.
- Those long BITX should consider mitigating potential losses from big down days by holding options that go up in value if Bitcoin or BITX drop dramatically in value. Options are available on Bitcoin, Bitcoin futures, and BITX.
- Traders believing that Bitcoin is going to drop in value can short BITX. If their forecast is correct, they will benefit from BITX’s leverage, volatility drag, and fees. However, as shown earlier in the best- and worst-case percentage moves tables, BITX’s leverage in tending multiday declines will likely not achieve 2X leverage.
Conclusion
BITX is not intended to be a buy-and-hold investment. Even if Bitcoin goes on to set new all-time highs, investors that buy BITX and never sell will very likely end up disappointed. On the other hand, BITX offers an aggressive trader a product that’s able to significantly compound Bitcoin gains, without the need for additional capital, or risking more than they invested.
Resources
Vance,
You’ve done a good job with this website. I’ve learned a lot.
I’ve traded BITX options for a while with reasonable results. Information on most options is readily available. For example option specifications for SPX are found with a simple Google search. However, I can’t find a link to BITX option specifications no matter what I do.
Do you know of a BITX option specification link?
Thanks,
Bill
Hi Bill,
While SPX are pretty unique options, I think BITX’s options are pretty generic, e.g., American style. This NYSE spec sheet for options on ETFs looks promising https://www.nyse.com/publicdocs/nyse/markets/arca-options/ETF_ETN_nyse-arca-options_etf-contract-specifications.pdf I suspect the other exchanges have something similar.
Best Regards,
Vance
Thanks,
Bill
Is backtest right till date price of BITX with dividends and fees?
See the projections/backtest were correct until pre-fees
Hi Sam, I’m been slow to update the backtest, but I think to answer your question, the existing free spreadsheet that goes through April 2024 includes fees. The dividends on BITX didn’t start until May 2024. The updated spreadsheet will include dividends as well.
— Vance
How accurate do you think this prediction/backtest is %wise?
Does it take into factors intra day swings or just open and close prices?
And if it’s run up to current date – will the numbers be close to current BITX price?
Sorry, I don’t do consulting for free. Contact me at [email protected] if you want to pay for consulting.
Best Regards,
Vance
Where does BITX’s substantial dividend come from?
Hi Steven,
My impression is that the dividends come out of the assets under management. Instead of applying the entire balance to bitcoin futures, they allocate a portion as cash, and then distribute it to shareholders of record.
Best Regards,
Vance
Uvix reverse split please!!!