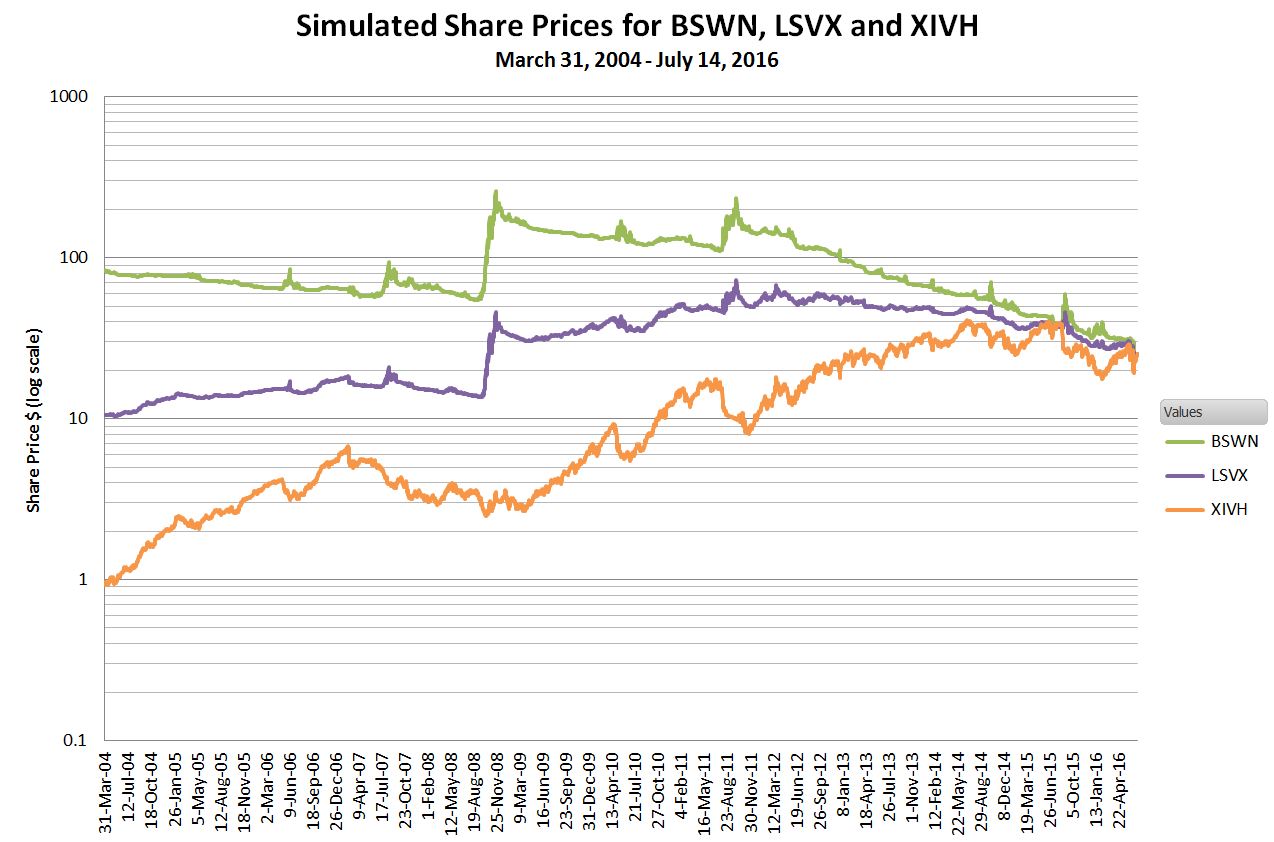
I have generated simulated end-of-day close indicative share values (4:15 PM ET) for VelocityShares’ BSWN, LSVX, and XIVH Exchange Traded Notes (ETNs) from March 31st, 2004 through July 14th, 2016.
- BSWN VelocityShares VIX Tail Risk ETN
- LSVX VelocityShares VIX Variable Long/Short ETN
- XIVH VelocityShares VIX Short Volatility Hedged ETN
These simulated ETN histories are useful if you want to backtest various volatility strategies using these funds starting in 2004. The chart below show the simulated values with a logarithmic vertical axis so that you can see a reasonable amount of information for each fund.
For a description of how these funds work, see this post.
The algorithms for generating these ETN’s values are documented in their combined prospectus and the underlying S&P 500 VIX Futures Long/Short Strategy Index methodology. The short term VIX futures index SPVXSP is used as the base index and all the specific fund indexes are calculated using it. The respective fund underlying indexes are:
| ETN Ticker | Underlying Index |
| BSWN | SPVXTRST |
| LSVX | SPVXVST |
| XIVH | SPVXVHST |
I calculate my version of SPVXSP directly from historic VIX futures settlement data. This futures data is available on this CBOE website—in the form of 100+ separate spreadsheets. To make the calculation of this index tractable I created a master spreadsheet that integrates the futures settlement data into a single sheet. See this post for more information about that spreadsheet.
My simulated values very closely track the published values of the underlying indexes (less than +-0.01% error) from the December 20, 2005 index inception date through the present, so I have very high confidence in the accuracy of these simulations.
These ETN prices reflect the contribution of 91-day treasury bills on their overall performance. Thirteen-week Treasuries annualized yields are running around 0.30% in 2016, but in February 2007 they yielded over 5%— things have changed a bit…
I am making these 3 simulation spreadsheets available for purchase, individually, or as a single spreadsheet with all three funds. These spreadsheets do not include the index calculations themselves. The only formulas included are the ones required to go from the underlying index of each fund (e.g. SPVXVHST for XIVH) to the final ETN values including fees.
In addition to the 1.3% annual fee, these funds charge a “Futures Spread Fee” that can change on a daily basis. There is no historical data available for the fee before the funds’ inception and I have not provided for changing the fee on a daily basis in the spreadsheet. I have made a guess that this fee will effectively add 0.3% to the overall annual fees. This guess can be changed for each fund at an overall level in the spreadsheet, however changing it will require regenerating a “seed” value to re calibrate the simulation to the actual IV levels. Details on how to do that will be included in the readme sheet.
For more information on the spreadsheets see this readme.
If you can’t see the pricing/ purchasing information at the bottom of this post please click this link.
If you purchase the spreadsheet you will be directed to PayPal where you can pay via your PayPal account or a credit card. When you successfully complete the PayPal portion you will be shown a “Return to Six Figure Investing” link. Click on this link to reach the page where can download the spreadsheet. Please email me at [email protected] if you have problems, questions, or requests. It’s easy to miss the “Return to Six Figure Investing” link. If you don’t get it / can’t find it please email me and I will reply with the spreadsheets you purchased attached.
So I’m trying to get a feel for BSWN — for example, yesterday (3-6)? It consists of an absolutely massive range, but there was no notable daily volatility change. What is yesterday’s bizarre action tied to? F2, F1 seem to be in a standard ratio. What is that all about?
Hi James, Looks to me like someone put in a market order when the market makers were quoting a very wide spread. The IV value is the thing to pay attention to–and if you buy or sell it you must use limit orders and uses prices close to the IV price.
Vance, for these data sets you offer, are there any updates included? For example, can license holders get updated data through the most recent quarter or something like that?
Hi James, I don’t automatically include updates. I view my value add as primarily providing the simulations for what the values would have been before the fund was actually trading. Once trading the fund’s values are readily available for free, so the value of my ongoing simulation value is mostly a double check on my source data / algorithms. I do update my simulations myself when it supports what I am working on and I’m happy to share those for free when I have them available.
Ok, that makes sense. I didn’t know if you were running simulations simultaneous to the now-running funds. It would be good to evaluate if/when there is any divergence.