Hardly a month goes by without some pundit trumpeting that the VIX is broken. But before you worry too much, consider some of the non-obvious characteristics of the Cboe’s Fear Gauge.
I often hear people in the finance industry saying that “The VIX® is broken”. The specifics of what they say varies a lot, but the typical pronouncements go something like this:
- The Cboe’s VIX is too low; it is not reflecting the current riskiness of the markets.
- The VIX is too high; the actual, realized volatility of the market for the last month has only been 5% but the VIX is reading 9.5%, a 90% premium.
- The VIX is too low; its historical average over the last 25 years has been 19, but for the last 8 months it has not exceeded a reading of 15.
- The VIX is not reacting properly to the moves of the market; it should always drop when the market goes up and climb when the market drops.
- The VIX is too low; the actual realized volatility of the market for the last month is 20% but the VIX is reporting 15%.
These boil down to a few common claims:
- The VIX is not correctly forecasting the future.
- The VIX is not tracking the market’s current volatility.
- Historically the VIX is mean reverting but it’s not doing that now.
- It is inevitable that volatility in the market will increase, but the VIX is not reflecting that.
- Since it is a “Fear Gauge”, the VIX should
always go up when the market goes down.
I will address each of these but first some background on the VIX itself (see the end of the post for a tabular summary).
First the Money, then the Volatility Measure
The Cboe’s primary interest in creating the VIX was to enable a new way to make money. They wanted to offer futures and options on volatility and needed a volatility index for those securities to reference. However, not any index would do. The Cboe needed an index that would enable market makers, a critical part of the market ecosystem, to cost-effectively hedge their long or short positions. The Cboe’s first methodology for the VIX, introduced in 1992, failed to accomplish that, but its second attempt, introduced in 2003, did the trick. Of course, to gain market acceptance the Cboe needed to produce an index that was a reasonable proxy for market volatility but their first priority was economic realizability, not how well the VIX matched recognized measures of volatility.
What did the Cboe End Up With?
The VIX’s value is computed based on the prices individuals and institutions are willing to pay to buy or sell a large set of S&P 500 (SPX) options. If the market is making big moves, then both put and call options will tend to be more expensive, and the calculated value of the VIX will be higher. If the market is quiet, the prices of options tend to drop and the VIX will drop as well.
The VIX’s methodology is noteworthy, and unique to my
knowledge, in that it enables direct bets on future volatility using a fixed
portfolio of options. Other approaches
to monetizing future volatility require intra-day monitoring and often require
expensive changes to the options/securities held. For more on the inner workings of the VIX see
“How
does the VIX work” and “A
Better Model for the VIX”.
Some of the Idiosyncrasies of the VIX
When people describe the VIX as broken it’s often because they are unaware of some of the VIX’s idiosyncrasies.
- The VIX is a crowdsourced indicator; it reflects actions motivated by forecasts as well as data.
- The process used to convert the VIX’s daily calculation to the final annualized number is based on the total number of days in a year, not the number of trading days.
- The VIX often includes a premium driven by economic factors.
- The VIX’s effective “look forward” horizon is typically relatively short even though it’s based on options with about 30 days until expiration. Exceptions to this can occur if there are upcoming “known unknown” events like important elections where outcomes might impact markets.
- The VIX factors in the possibility of mean reversion during volatile times.
- Out-of-the-money (OTM) put prices can have a large impact on the VIX.
- The VIX has some additional eccentricities on the day before and the day after weekends and holidays.
These idiosyncrasies are the root of most misunderstandings about the VIX. In the next section, I will go through each of these in detail.
The VIX is a Crowdsourced Indicator
The SPX option prices included in the VIX’s calculation have an analytical component but they are heavily impacted by factors that can only be estimated, forecasted, or felt by the market participants. On the analytical side, we know exactly how much time an option has until its expiration and how far its strike price is from the current level of the S&P 500 index. However, we can only estimate the current level of volatility in the market, which is a huge factor in option pricing. Option prices reflect human/machine forecasts for market direction, trends in volatility, seasonality, and the potential market impact of upcoming events (e.g., elections, Federal Reserve announcements). As evidenced by its unofficial title as the “Fear Gauge”, the VIX also reflects the mood of the market. If things are scary and the markets are crashing investors will pay a premium for protective options—driving up the value of the VIX.
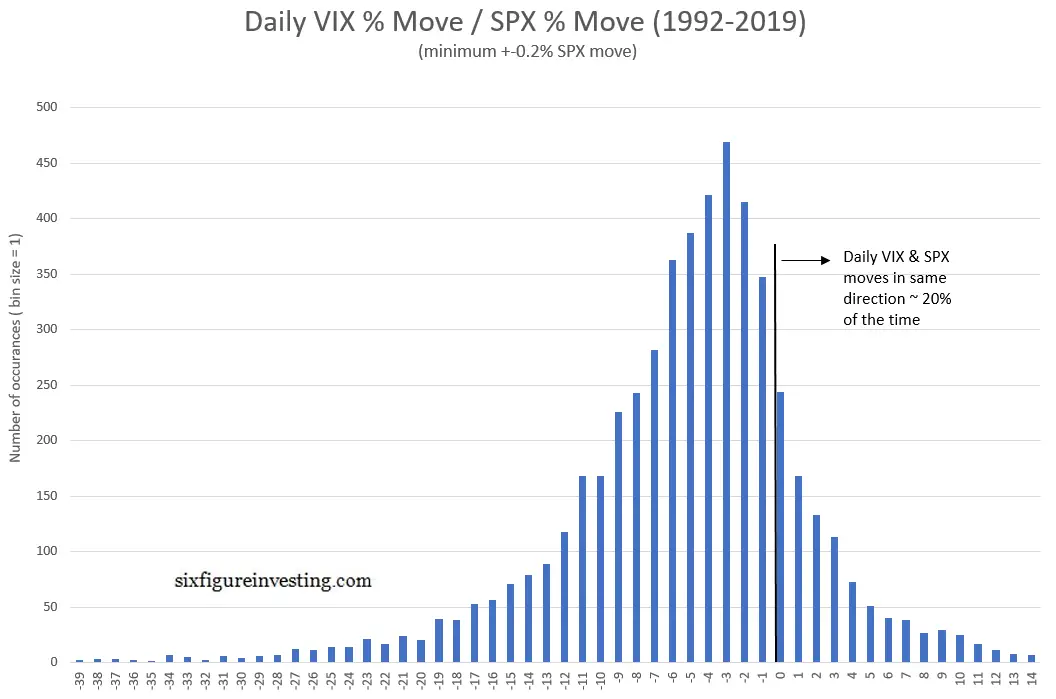
The organic side of the VIX confounds simple mechanistic views. For example, while the VIX usually does move in the opposite direction of the S&P 500 index, there are times when they move in the same direction. For example, if the market is feeling toppy to SPX options traders, they’re inclined to pay more for protective puts, which might drive the VIX higher, even though the SPX is going up that day. The histogram below shows the historic relationship between the moves of the VIX and the S&P 500.
The VIX uses Calendar Day Annualization
If you’re are serious about comparing the VIX’s value to other volatility measures then something called annualization must be factored in. When measuring volatility, the time frame of the measurement is important. Obviously, if you are looking at price changes every five minutes, you’re likely to get smaller moves than if you are comparing day-to-day closing values. To coherently compare volatility data taken over different measurement periods we need a scaling factor.
If we are measuring something like velocity the scaling factor is intuitive. We can measure the distance a car travels in one minute and multiply that by sixty, the number of minutes in an hour to compute miles per hour. Volatility is different, it requires a non-linear scaling factor. For example, to convert a one-minute volatility measurement into hourly volatility, we need to multiply by the square root of the time factor, so the one-minute measurement should be multiplied by the square root of sixty, approximately 7.746, to get volatility per hour. Not obvious, I know. The reasons for this are outside the scope of this post but are discussed in “Volatility and the Square Root of Time” and “The Myth of Option Weekend Decay”.
To maintain consistency (and our sanity), volatility
practitioners normally convert their measurements into an annualized percent
when doing comparisons. There are two common variants of this; the VIX uses
calendar day annualization, which assumes 365 days in a year, while many historical/realized
volatility measurements use trading day annualization. In the USA the average number of trading days
is 252. The difference between the two
approaches is substantial—calendar annualization on average is 17% higher. There are some advantages to calendar day annualization;
it avoids conflicts with different trading calendars between countries due to
holidays, as well as issues due to unplanned market closures. However, calendar
annualization tends to overstate true market volatility. In any event, before you say the VIX is
broken because it is running higher than your favorite volatility metric, make
sure you adjust for annualization factors.
The VIX Often Contains an Overhead Premium
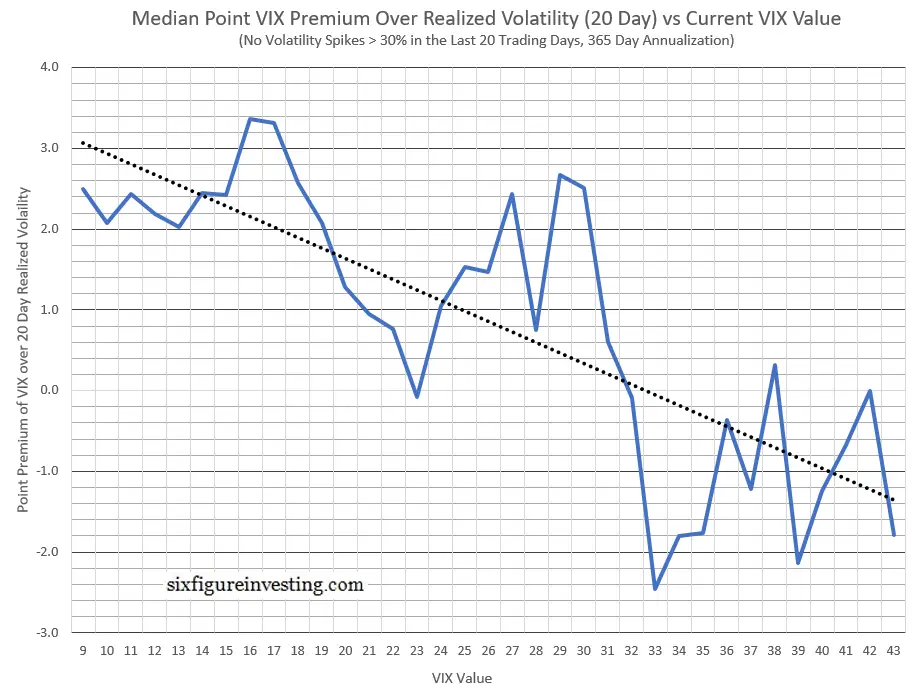
SPX option market makers have operational and transactional expenses, such as costs of capital, risk constraints, and profit requirements, that they must cover/achieve when they engage with the market. These overhead factors are included in the prices of the options. Because the VIX is based on options, these additions result in the VIX’s value typically running a few percent higher than actual market volatility during quiet market periods. In addition, these overhead factors effectively create a floor for the VIX at around 9 (the record 15-year intraday low is 8.84). When the market is in turmoil the VIX’s overhead component is overtaken by mean reversion effects, resulting in the VIX often reading below realized volatility. The chart below shows the median point differences between the VIX and one-month realized volatility in the S&P for various values of the VIX.
The VIX’s Predictive Power is Limited
The Cboe designed the VIX to “reflect investors’ consensus view of future (30-day) expected stock market volatility.” This statement is literally true because the VIX’s value is computed from SPX options with an average of 30 days until expiration, but the predictive power of this crowdsourced view is usually poor. Multiple studies have shown that the VIX does not reliably forecast market meltdowns.
While you’d expect the market participants buying/selling options with 30 days until expiration to be making 30-day price predictions, they are mostly concerned with predicting the volatility between now and then. If volatility is expected to be high, then it’s more likely for both put and call options to end up in the money and hence be more valuable. In practice, option market participants are not particularly good at predicting the future, so they start with the tenet that the best predictor for tomorrow’s volatility is today’s volatility. From this embarkation point, option pricing algorithms add something called mean reversion.
The VIX Factors in Mean Reversion
Stock market volatility, specifically the S&P 500 portion of it, is not a growth business. Annualized volatility can’t go below zero (the lowest 21-day realized volatility since 1950 is 2.97%) and the maximum level of volatility, while not constrained, has historically max’d out at 120%. Market volatility does not stay at very high or very low levels for very long. Over the course of a few days, it will usually start moving towards its average, or mean level. This drift towards the mean is called mean reversion and is factored into the pricing of options depending on how long they have until expiration and the current level of volatility.
Volatility mean reversion is not a force of nature, it’s a tendency. It’s tempting to think of the level of market volatility as a pendulum that wants to swing back and forth but there’s nothing so mechanical about it. Markets can stay at low volatility values for a long time, there’s nothing inherent forcing volatility to increase. Periods of high volatility are more transitory, unless there’s a steady stream of increasingly bad news, volatility will start receding. For more on this topic see this post. The VIX’s forecast of mean reversion is most visible when the market is panicking. In those situations, the realized volatility is often quite high and the VIX’s value, contrary to its usual behavior, is usually lower than realized volatility—reflecting the tendency of markets to relax after a scare.
The VIX is Very Sensitive to the Price of Out-of-The Money Puts
If a volatility metric doesn’t need to be economically realizable, it’s straightforward to construct a volatility metric using the prices of equity options. In practice, option-based volatility measures include multiple options and potentially other securities (e.g. futures or stock) to smooth out the volatility readings during small price moves in the security that the options reference. This reference security is called the “underlying”.
For underlying price shifts of more than a few fractions of a percent, the portfolio of options used for the measurement needs to be changed. If it’s a theoretical index that’s not a problem, you just look up prices for a different set of securities, but a real-time investable index would need to implement a scheme where these specified options were bought and sold intraday, with minimal losses as the underlying shifts. Practical issues like commissions, bid/ask spreads and front-running risk due to public knowledge of what options would need to be bought or sold make this sort of approach untenable.
The VIX enables economic realizability by specifying a wide range of options of different strike prices to be included in the portfolio (e.g., from -35% to +10% of the current SPX value) that desensitizes the overall portfolio value to the moves of the underlying. The summed prices of all these options combined with some weighting factors are used to compute the VIX’s value. The chart below illustrates how a fixed portfolio of options, with all their non-linearities, can be combined to generate a volatility metric that’s linear, within limits, despite the moves of the underlying (flat portion of green line).
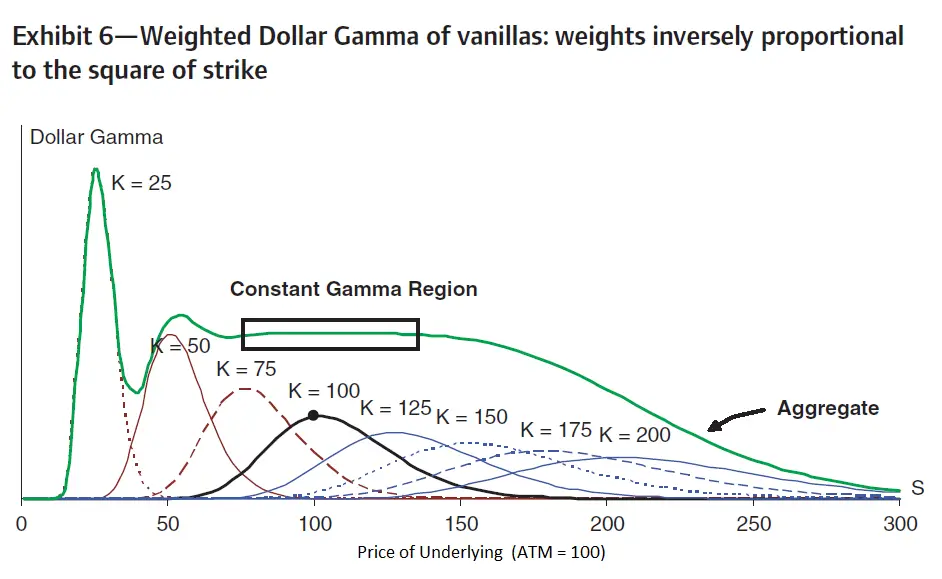
From: Introduction to Variance Swaps by Sebastien Bossu, et al., WILMOTT Magazine
Most of the time the VIX is a theoretical index because the practical realization requires options with exactly 30 days until expiration. Once a week, typically Wednesday mornings, when there is a set of SPX options meet this requirement, the theoretical and tradable VIX align. This synchronicity is put to use in the final settlement process for the VIX futures and VIX options that expire that morning. The Cboe runs an auction, usually concluding by 10:00 AM ET, where the SPX options in the specified portfolio change hands and the resulting prices are used to compute the final settlement price ($VRO) of the futures and options.
All of this is a very long preamble for why the VIX is sensitive to the prices of out-of-the-money options. If you’re not familiar with the concepts of at-the-money and out-of-the-money options this article might be helpful.
Out-of-The-Money (OTM) puts prices are included in the VIX’s summation calculation, and due to the VIX’s weighting algorithm they have, dollar for dollar, a bigger percentage impact on the VIX’s value than near-the-money options or OTM calls. OTM SPX puts also tend to have higher prices than expected theoretically. Traders have learned over the years that the current level of market volatility tends to underestimate the likelihood of a market crash, so they tend to pay a premium for put options as an insurance policy on market panics. This asymmetry of prices can be quantified as something called skew. The Cboe has an index called SKEW that measures this degree of imbalance, which is usually proportional to the nervousness of traders. This imbalance is always present and results in a higher VIX value than if you only used closer to-the-money options.
Far out-of-the-money puts add one additional eccentricity to the VIX’s price. The VIX calculation specifies that only puts or calls with non-zero bids (offers to buy at $5 or more) are included in the VIX calculation. Anyone that’s authorized to trade SPX options can put in an order to buy one or more puts at $5 or higher on the highest strike option that currently has a zero bid. If no sellers immediately appear to take your offer that option would now be included in the next VIX calculation (done every 15 seconds during market hours)—potentially bumping the VIX up a few percent. It seems scandalous that this is possible but in general it would not be a way to make a profit. Most of the time the VIX is a theoretical index with no security closely tracking its value, however during the weekly Cboe settlement auction this could be a potential manipulation strategy and the Cboe monitors this HOSS auction very closely for potential bad faith trading activities and punishes offenders.
The VIX has Day of Week Eccentricities
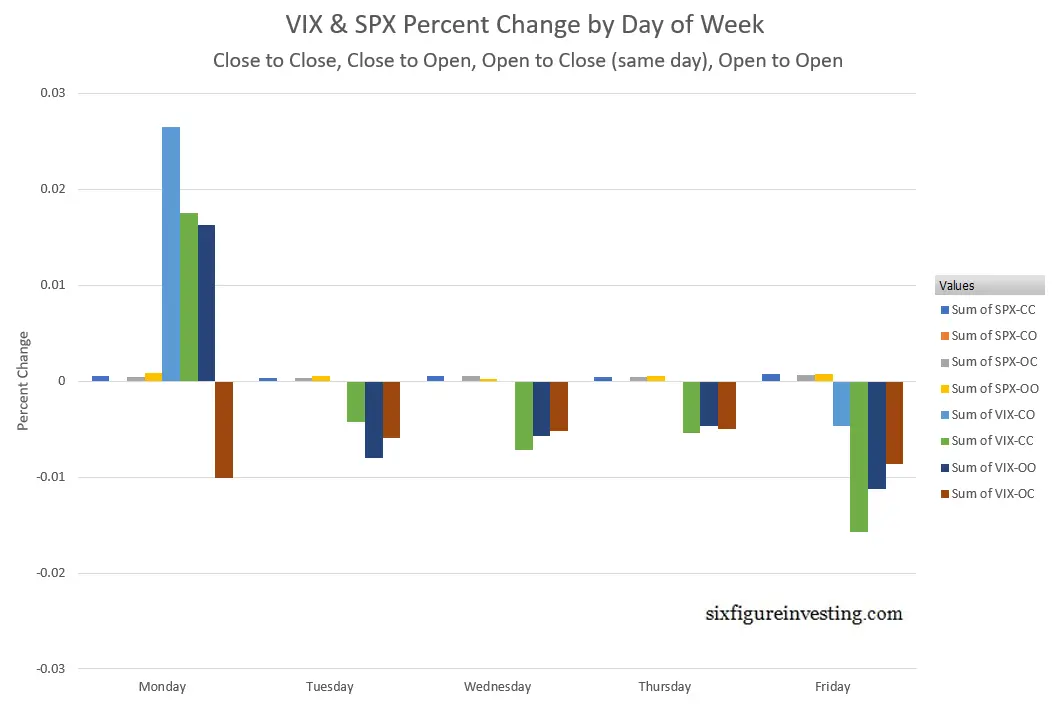
Before the age of computers, there might have been exploitable day-of-week patterns in the S&P 500 index. For example, you could imagine that Friday afternoon profit-taking before the weekend might create a tendency for Friday’s close to be lower than Thursday’s close. Computers made it practical to look for, and trade any day-of-week tendencies. In the case of the S&P 500 index, these metrics (day-to-day close to close, close to open, open to close, and open to open) now trade within 0.07% of each other on various weekdays. If there ever were any economically exploitable tendencies, they have been extinguished by strategies designed to profit from those tendencies.
The VIX, on the other hand, has big day-of-week patterns. For example, the median percentage change in the VIX from Friday close to Monday open is +2.6%. This pattern persists because there is no way to directly trade the day-to-day moves of the VIX. The chart below shows the various day-of-week metrics of the VIX compared to SPX. The big bars are all VIX related, the small bars are all S&P 500 numbers.
The VIX’s Monday and Friday tendencies are referred to as the “Weekend Effect” or the “Monday Effect.” Opinions differ as to the root cause (more on this here) but I think it’s a combination of market makers dropping implied volatility before the weekend, option prices not decaying while markets are closed, and the calendar annualization calculation dropping the number of days until options expire by three days when trading opens on a Monday.
While it might feel like the VIX is broken when both it and the S&P are up on a Monday morning remember this effect is predictable and it resolves itself by Tuesday. If in doubt, you can always check the VIX futures values. They don’t show these effects— their statistics are similar to SPX’s.
Why So Complicated?
If you’ve made it this far, you may be convinced that the VIX is not broken, but you may also be wondering why something this complicated and eccentric is popular as a gauge of volatility. Isn’t there a simpler way?
The short answer is no. There isn’t a way to directly measure volatility at a single instant of time—it can only be estimated. Volatility estimates based on historic price movements are typically less complicated than the VIX but in trending markets or in cases where market volatility declines rapidly, they can give nonsensical estimates. The VIX and other option-based volatility measures like Nations’ VOLI better handle these situations. Despite its quirks, the VIX is impressive.
The Cboe does not claim the VIX is the perfect volatility measure, or that it predicts the future. What the VIX does accomplish is enable a market where investors can trade “VIX style” volatility—which does reliably track major volatility moves in the market. If you still think the VIX is broken, maybe you should put some of your own skin in the game.
A Tabular Summary
These charts list possible explanations for perceived VIX “brokenness”
| Market in Low Volatility State (Low Vol = 21-day std dev log returns < 10%) | Market in High Volatility State | |
| Complaint: VIX too high | Possible Reasons: * VIX has an overhead component * OTM puts in demand * 365 vs 252-day annualization | Possible Reasons: * OTM puts in demand * 365 vs 252-day annualization |
| Complaint: VIX too Low | Possible Reasons: * VIX does not forecast market crashes * VIX is not in a hurry to mean revert when volatility is low | Possible Reason: * VIX prices forecasting future mean reversion |
| Complaint: Unexpected VIX moves or in “wrong” direction | Possible Reasons: * Weekend or Monday Effect * Market “toppy”, traders buying OTM puts for protection * Market decline is losing momentum, SPX option holders taking profits * Upcoming “Known Unknown” event with potentially negative effects on the markets (e.g., elections, Federal Reserve announcements) |
Hey Vance,
I am aware that vix tends to rise on Mondays and fall Tuesdays through Fridays. Also seasonality shows vix increasing .mid July through mid October and in late January. I have been cutting my exposure in half for the extended hours sessions to avoid risk at times when it cannot be reacted to, so in order to make money, I need to make more in the day session than I might lose at night.
Are you aware of any studies that quantify the historic performance of vix or vix futures in day sessions vs extended hours?