Over the years I have developed a lot of respect for the condition of breadth divergence, when an index such as the S&P 500 is rising and the NYSE daily cumulative advance-decline line is not. In January 2016 I listed the performance of my method on the short side as a function of the number of consecutive weeks of divergence at the time of the short signal. The optimum interval was 41 to 79 weeks, and as that interval was being approached, I speculated that a profitable short could be on the horizon.
It didn’t work out that way. The last short began on December 11, 2015 at 31 consecutive weeks of divergence. That short ended with a 3.8% profit on Feb. 26, 2016 and the method returned to 100% long. That trade is now ahead by about 10.6%, but what may be more significant is that divergence ended on April 22, 2016. Thus a new short beginning any time soon does not have an especially good chance of ending profitably (but of course I will take it—one never knows for sure about these things). See this post for my track record in calling corrections.
Might divergence ending after such an extended period (49 weeks as of April 15, 2016) have bullish implications? I wondered, so checked, and discovered the following dates at which divergence periods from 31 to 109 consecutive weeks had ended. I then noted how long it had been from that date to the date of the next small cap market peak which had been followed by a decline of 19% or more. Results are as follows:
| Divergence End |
Small Cap Peak |
Lag |
| 17-Feb-61 | 1-Dec-61 | 287 days |
| 17-May-63 | 22-Apr-66 | 2 Years 341 days |
| 25-Sep-64 | 22-Apr-66 | 1 Year 209 days |
| 10-Dec-76 | 8-Sep-78 | 1 Year 272 days |
| 19-Sep-80 | 12-Jun-81 | 266 days |
| 22-Oct-82 | 24-Jun-83 | 245 days |
| 15-Feb-85 | 21-Aug-87 | 2 Years 187 days |
| 30-Jan-87 | 21-Aug-87 | 203 days |
| 28-Apr-89 | 6-Oct-89 | 161 days |
| 30-Aug-91 | 17-Apr-98 | 6 Years 232 days |
| 24-Dec-92 | 17-Apr-98 | 5 Years 115 days |
| 2-May-03 | 13-Jul-07 | 4 Years 73 days |
| 24-Jul-09 | 23-Apr-10 | 273 days |
There was quite a variation, from slightly over 5 months to more than 6 years. The amount of gain also varied widely, suggesting that an average or median of either would be of questionable value. However, the import clearly seems to be that breadth reaching a new high after a considerable period of deterioration is a bullish sign.
Another bullish sign has been daily NYSE breadth since the February 11, 2016 low. There are several ways to measure this, but one meaningful way is to sum the number of advancing issues and the number of declining issues over N days and then compute the ratio of the former sum over the latter.
On April 22, 2016 this ratio was 1.46. Since 1948, only 5 times has this ratio been this high or higher:
29-Jan-71
4-Mar-75
18-Feb-76
18-Oct-82
15-Sep-09
Market historians will recognize all of these as times when significant bull markets had been established and outsized gains lay ahead before the next severe bear market began; each time the beginning of that bear phase was a long way off.
Of course, none of this can be any guarantee of what the market will do, but over the years I have found breadth to be one of the best indicators available. I am confident to be 100% long now, but as always, I have my eye on the exit sign.
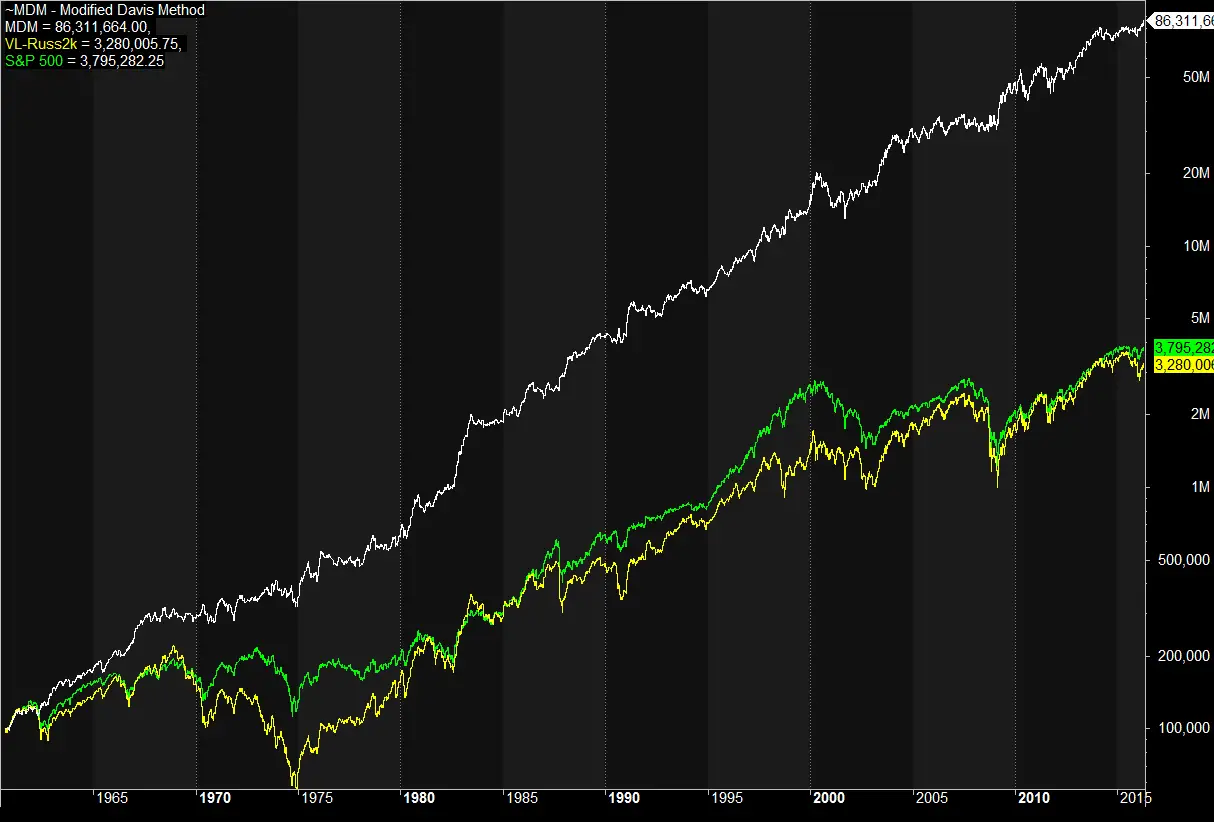
Below is the latest chart of my method’s performance from 1960 through April 22, 2016 (click to enlarge).
Click here to leave a comment