Probably the most difficult thing to do in stock market investing is to identify a good time to sell. Many technical indicators have been devised to identify lows around the time they occur or soon thereafter with a moderate degree of success, but to my knowledge that has not happened for tops with comparable success.
My own modified Davis method does not do a very good job at this. It does profit on the short side, but only about 2% per year on average. Were it not for the occasional severe bear market where my method will be short or at most 50% long—enabling significant funds to be invested near the beginning of the next bull market, my method probably would not do any better than buy and hold over the long term.
However, I have discovered a tendency which I think is nice to know, based on the length of the breadth divergence period preceding the short signal. My test for breadth divergence uses a measure similar to the classic cumulative advance-decline line. As a bull market matures there will be a point when prices make new highs, but that high is not accompanied by a new high in the cumulative advance-decline line. This is the point of breadth divergence, and this phenomenon has occurred near the end of virtually all bull markets. Stan Weinstein described this metric in “Secrets For Profiting in Bull and Bear Markets” almost 30 years ago, and he probably wasn’t the first to do so.
When developing my buy/sell algorithms, I avoid the trap of fitting my approach to the historical data by using only an older subset of the historical data to determine my thresholds. I then run my method forward test on the newer, out of sample data, to determine how it would have performed.
Here is a list of all of the short trades in my forward test, arranged by the number of consecutive weeks of divergence in effect at the time of the signal. The chart below summarizes the results.
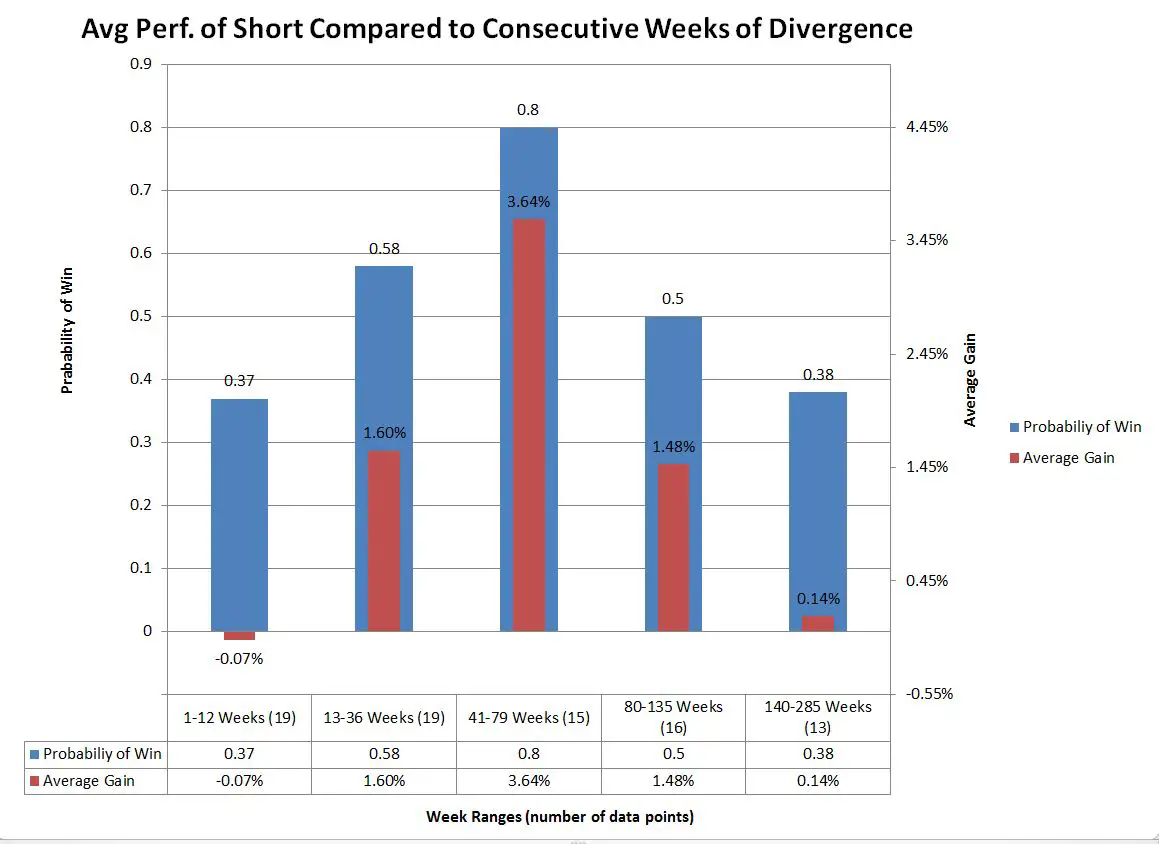
It appears that divergence must be in place for at least 13 weeks to have a good shot at a successful short. In particular, it also appears that there is a “sweet spot” from 41 to 79 weeks. There, the probability has been 0.80 of a profitable short. Over the entire period there were 5 shorts that resulted in double-digit profits, and 2 of them occurred in this interval. Beyond 79 weeks the probability of success declines significantly. (Bear in mind that the method shorts at the 50% level, so these figures would be doubled if it shorted at the 100% level.)
Note that something similar to a normal distribution is formed in the above chart. I am no statistician, but it may be that these results are indicative of some degree of natural order in the workings of the stock market.
However, there does not seem to be anything here that could be incorporated into my modified Ned Davis algorithm, and even if it could, that obviously could not be considered as part of the forward test. The only thing to do is to take every short as it comes, as one never knows for certain when “the big one” will begin.
At the last short (12/11/15) of my method, divergence had been in effect for 31 weeks. At this writing, the figure is 34 weeks, and it will take a very strong market to end this condition. The current short may not end profitably, but the next short may have a good chance of being in the 41 to 79-week sweet spot.
Click here to leave a comment
1 thought on “Guest Post: Short “Sweet Spot” Approaching, Jan 2016? —by Frank Roellinger”