During a significant market correction everyone knows that the long volatility funds like VXX, TVIX, and UVXY soar, while inverse funds like XIV and SVXY get crushed—no subtlety there. However, there are a class of volatility funds that attempt to finesse their way through market downturns. They change their allocations based on market conditions or use periodically rebalanced mixes of VIX futures in an attempt to minimize the damage, and in some cases profit from corrections / crashes.
The data below shows how these funds performed during the February 2014 dip where there was enough increase in volatility measures for these funds to start showing their mettle. There are only 6 of these dynamic funds, with 5 different strategies (Barclays’ VQT and PowerShares’ PHDG follow the same S&P VEQTOR index). Three funds: XVZ, VQT, and PHDG are designed to provide significant profit during downturns, while SPXH, TRSK, and VIXH attempt to track the S&P index closely during the good times and reduce the degree of loss during the bad.
This first chart shows the best and the worst performers starting on Jan 15th compared to the S&P 500 (represented by SPY).
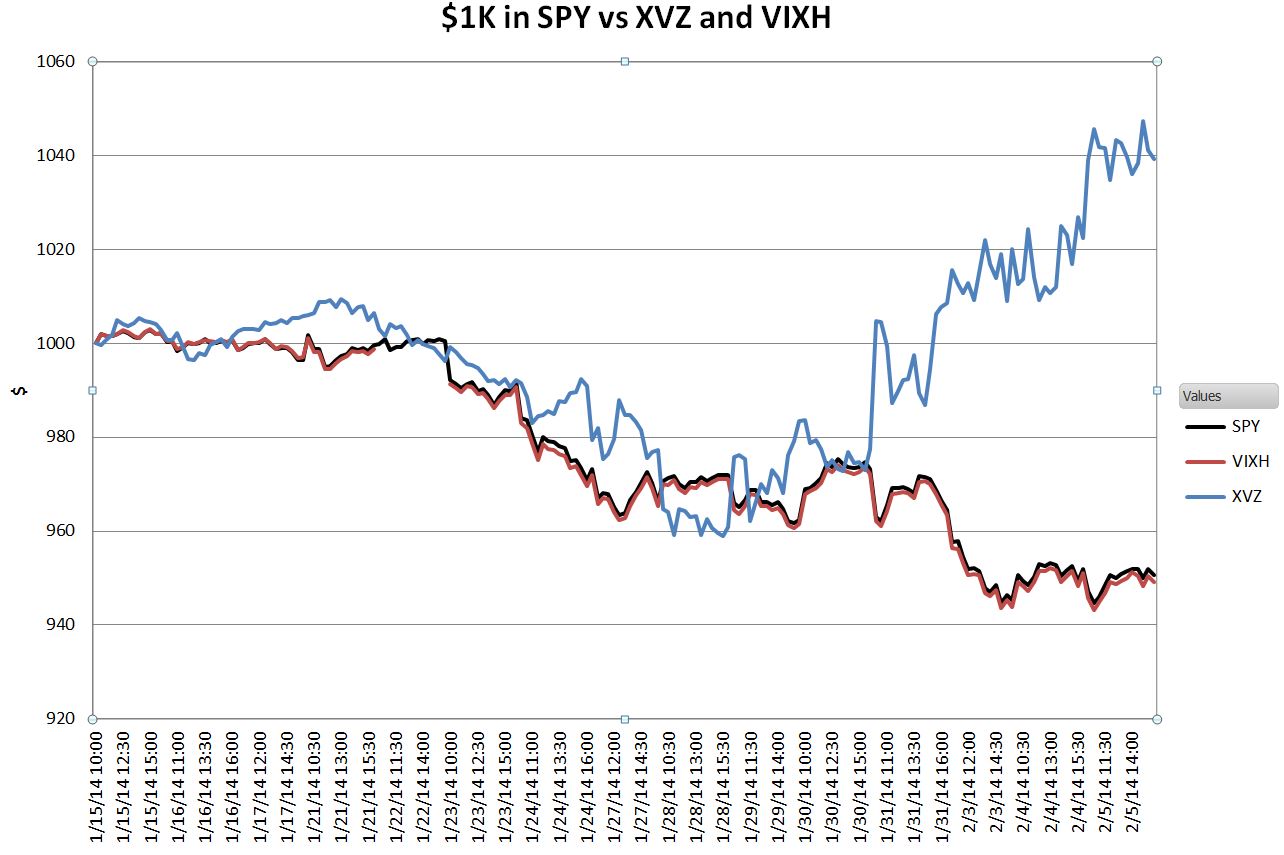 |
Barclays’ XVZ delivered an impressive 4% gain, while First Trust’s VIXH hasn’t deviated from the S&P—presumably its VIX option based hedging strategy hasn’t kicked in yet. XVZ looks good in this chart, but overall it has been a big disappointment since its introduction in 2011 because of poor performance during bull phases when its medium term volatility futures positions are eroded by contango.
The next chart shows VQT/PHDG as well as VelocityShares’ TRSK and SPXH funds.
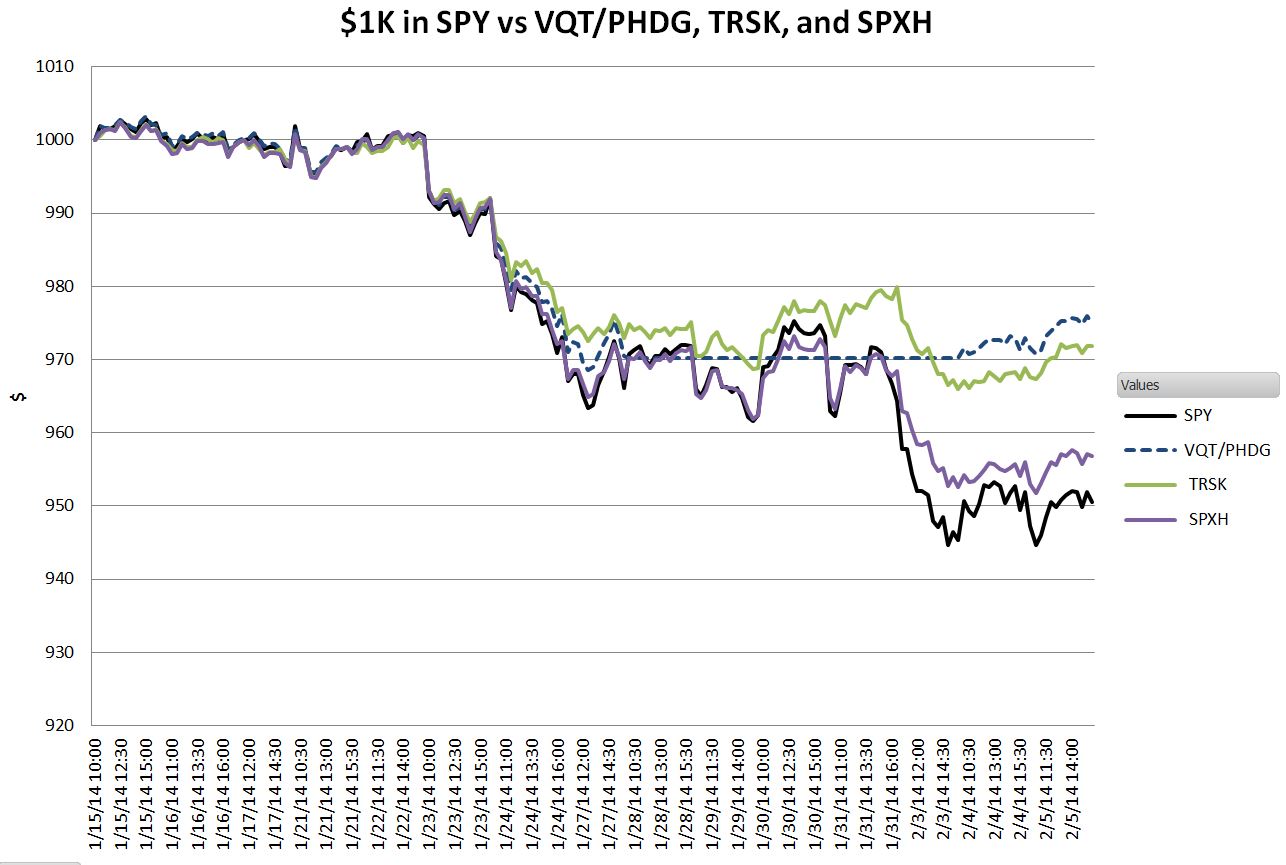 |
The VEQTOR based VQT and PHDG (dashed line) have limited their downturn to around 2.5%, with TRSK trailing by a few tenths of a percent. Notice how VQT and PHDG went flat from January 28th through February 3rd—their strategy put them in cash during that period, which saved them from the damaging February 3rd decline. SPXH’s hasn’t dampened losses much yet, but it tracks the S&P 500 quite well during bull markets (only a 1.4% lag since inception)—something none of these other solutions can claim. SPXH only started trading in June 2013, and initially didn’t have much inflow, but recently it’s gaining momentum with assets under management climbing to $24 million.
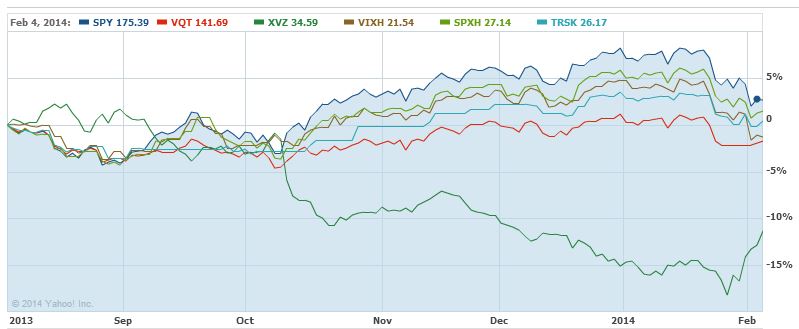 |
This last chart shows the Achilles heel of most of these funds—significant underperformance during bull markets.
SPXH (light green) lags the least, with XVZ (dark green) and VQT/PHDG (red) suffering the most.
For detailed analysis of how these funds work see:
- Under the Hood of VQT—Looking Forward to a Crash
- A Close Look at VXZ
- SPXH—Hedging the S&P 500 for Free
For a list of all USA volatility funds see Volatility Tickers
Click here to leave a comment