Update
TRSK & SPXH were shutdown in March 2018, probably because they never gained enough assets to be profitable for the issuer. In general, these fund performed as expected. They likely would have really done well in a major correction or bear market but that didn’t happen during their lifetimes. Their main weakness is that they tended to lose value when volatility makes sudden shifts.
The holy grail of investing is achieving high growth with low risk. Practical strategies mix different types of investments in the hope/expectation that losses in some areas will be offset by gains in others. Unfortunately, this has gotten tougher over the years because many asset classes (e.g., commodities, bonds, stock market sectors) now tend to move in lockstep when the market is panicking—making it difficult to get effective diversification.
Some investments like puts on a stock or index position reliably move in the offsetting direction but are expensive, extracting ongoing costs that reduce your overall return—sometimes for years. Your return can be pretty bad if a correction or bear market doesn’t come along.
VelocityShares’ TRSK and SPXH ETF’s offer some interesting new tradeoffs between growth and risk. Both funds use the S&P 500 index as the growth driver with 85% of the assets. The remaining 15% is invested in volatility positions with the intent of minimizing the primary risk to the equity position—big bear markets.
The chart below is my simulation of how a $1K investment in these products at the all-time high in 2007 would have fared during the 2008/2009 bear market compared with SPY, the biggest S&P 500 index ETF.
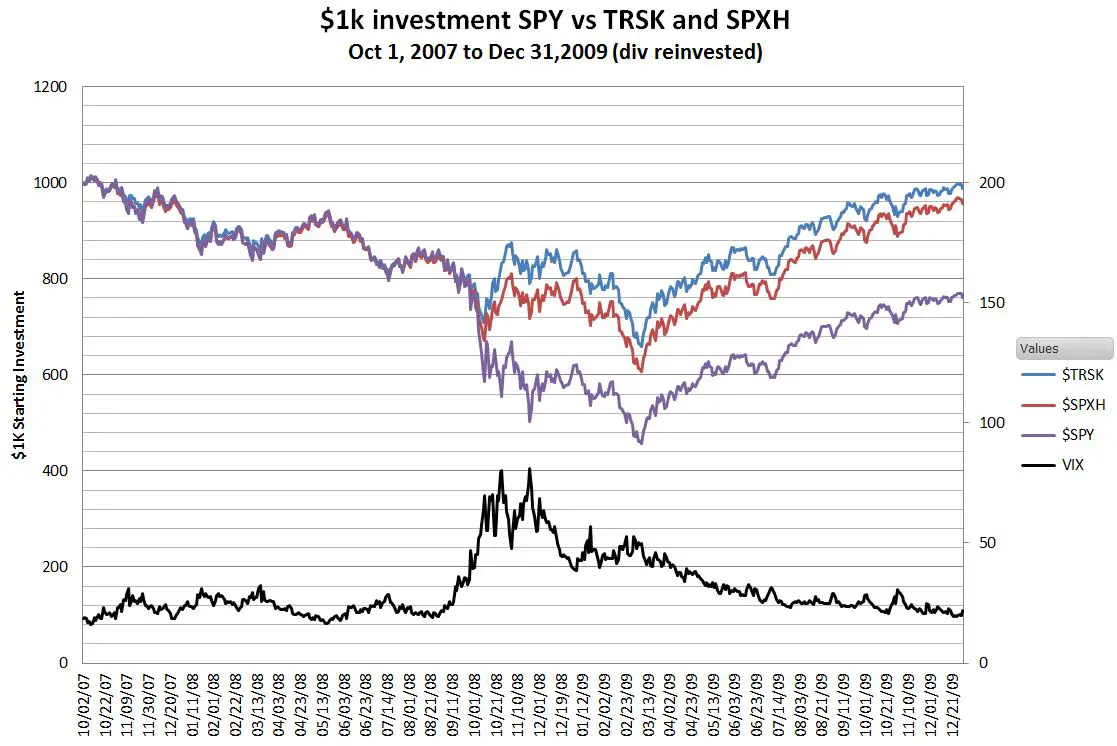
While not undamaged, the simulation shows that TRSK / SPXH would have fared significantly better than SPY.
|
Symbol |
Max Drawdown % | Recovery Time to Prev. High |
|
SPY (div reinvested) |
55% | 54 Months (Mar-2012) |
|
TRSK |
35% | 15 Months (Jan-2010) |
|
SPXH |
40% | 17 Months (Mar-2010) |
During a bear market TRSK will hold its value better, but in sustained bull markets, where the market spends most of its time, SPXH should be a better performer.
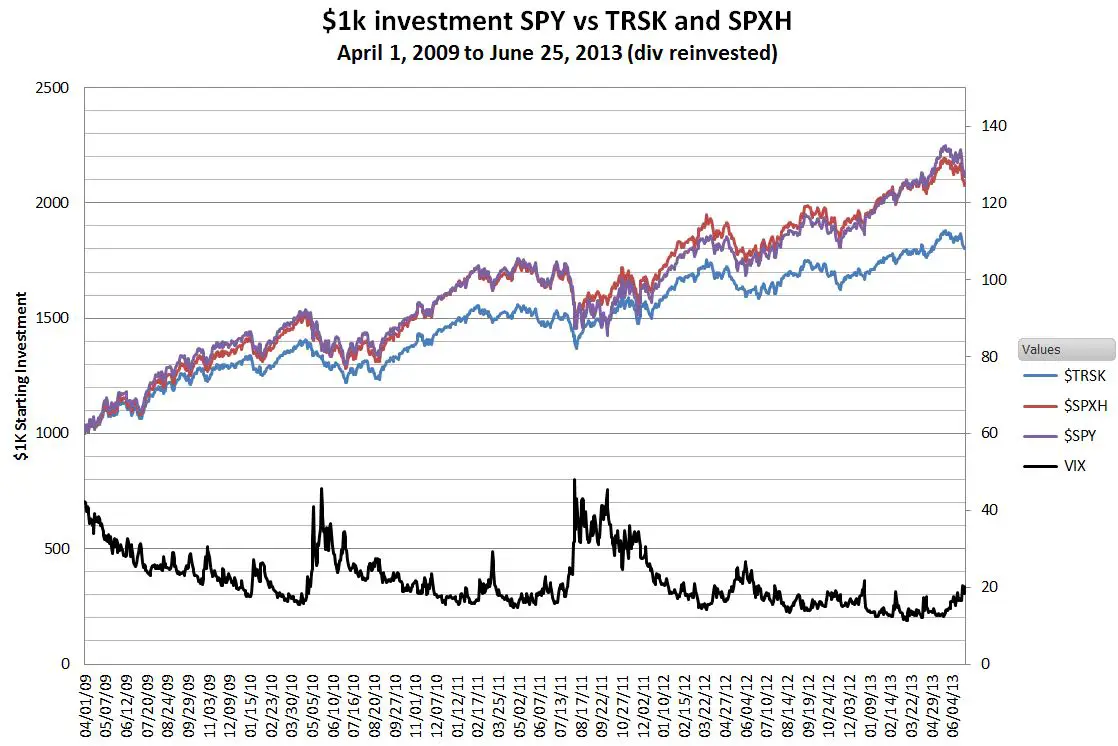
While TRSK gained 80% over this 3 year period, SPXH gained 110%—almost identical to SPY’s performance. SPXH’s level of portfolio protection was free!
SPXH and TRSK are the first volatility exchange-traded products to be structured as Fund of Funds (FoF). Instead of investing in the S&P 500 directly these VelocityShares funds hold equal portions of the three largest S&P 500 Index ETFs: SPDR’s SPY, iShares’ IVV, and Vanguard’s VOO. Because the annual fees of these giant funds are minuscule (.09%, .09%, and .05% respectively) the traditional complaint about mutual fund style Fund of Funds—paying high fees for both the fund and the funds it holds does not apply.
On the volatility side, the default ETFs will be ProShares’ UVXY 2X long and SVXY -1X inverse funds. These have annual fees of .95%, but from reading the VelocityShares TRSK/SPXH prospectus it appears that the FoF managers intend to implement the volatility positions with swaps whenever practical, which should lower the fees that must be paid to other companies. The VelocityShares funds themselves will charge an annualized fee of 0.75%.
SPXH and TRSK will be the second and third volatility funds to distribute a dividend from the equity portion of the asset allocation (PHDG was the first). The S&P 500 composite yield has been running around 1.75% per year, so I expect these funds to yield around 1.5%. Be aware that the indexes that these funds attempt to track assume dividends are reinvested, so if you want to track the indexes with your investments you should turn-on automatic reinvestment of dividends.
By providing two funds with different hedging characteristics VelocityShares acknowledges that one size does not fit all. TRSK provides better downside protection but lowers the return during sustained bull markets. SPXH and SPY had compound annual growth rates of about 20% during the 2009 to 2013 bull market. TRSK’s annual return during that same period was around 16%, so the additional protection (unneeded in this case) reduced the growth rate by around 4% per year.
I don’t know what it is about volatility investing, but it seems to have a special talent in producing products with dizzying complexity. In the case of TRSK and SPX we have two funds based on indexes that are based on funds that are based on other indexes that are based on futures that are occasionally synchronized with another index (CBOE VIX). To help navigate this maze I’ve created a hierarchy and listed some associated resources:
Level 1
|
Level 2
|
Level 3
|
Level 4
| Ticker | Description | Reference Securities | Website | Historical data | Resources |
| SPVXSP | S&P 500 VIX Short-term Futures Index | VIX Futures | S&P Indices | TR version (column B) | Index Methodology |
Hey Vance – thanks for all your insights. Would your previous covered call proxy with SPY verticals and VQT work for these? If so, which do you think would fare better?
Thanks,
Sam
Hi Sam, Neither of these products have a dramatic upside if the market crashed. On the other hand they track SPY better than VQT. If you’re bullish and just want a little downside protection then SPXH is attractive, if you’re bearish then VQT would still be better.
I realize this is mostly a volatility product-based blog, but if you want a less costly hedge that only protects against the larger downturns maybe a tactical allocation to treasuries or tips is appropriate. Especially when the yield curve is inverted
Hi Greg,
While I do focus on volatility I’m very interested in any approach that enables the effective diversification of a portfolio.
Perhaps you can educate me. At this point, with tips’ yield factoring in inflation below zero I don’t see any crash protection from them. Regarding treasuries, if longer term treasuries had high yields then dropping interesting rates plus their duration leverage could be a great hedge, but with longer term treasuries at 2-3% it doesn’t seem like there is much hedge opportunity there. With an inverted yield curve, on the other hand the short term bonds would be attractive in case of a recession, but it doesn’t seem like there would be a lot of leverage there. Thoughts?
Best Regards,
Vance
Looking at your previous backtest of VQT, it looks like these new products do not hedge as well or perform as well in the long run. Am I missing something?
Hi Emm1,
Good question. Depending on the timeframe you select you can make VQT look very good, or pretty bad compared to these products. VQT shines during big corrections or bear markets, but it has been truly underwhelming during this bull market. None of these products looks like a true buy and hold solution. I’m currently thinking about strategies for switching between them.
— Vance
Hi Vance,
Great post. I wonder how these strategies would compare to the much simpler following ones: 100% SPX except when the previous day VIX futures are in backwardation (or contango less than 1%), then 0% SPX and one of (0%,10%,20%,30%…) UVXY.
Hi EIi,
As I was working on the post I had similar thoughts. These funds have a lot of moving parts and still end up with major drawdowns in bear markets. As a signal the VIX/VXV or equivalent in the VIX futures market has been pretty reliable.
— Vance
Thanks for the deep dive on this, Vance.
So these things only work assuming there is a gentle transition from contango to backwardation in the VIX futures slope?
They don’t assume a gentle transition, but the hedging effect takes some days to kick in. They don’t help with flash crashes for example. TRSK did mitigate the summer 2011 correction.