Update
This article was first posted in September 2012. The strategy outlined below worked well until August 2013 and then basically went sideways for over 3 years before perking up again in 2017—when virtually any short volatility strategy worked. I’ve updated the chart and the verbiage to reflect those changes. In September 2017 the Cboe renamed its VXV index as VIX3M. The Cboe does not do things that that randomly so I wouldn’t be surprised to see VIX3M based products in the future.
___________________________________________________________________________________________
The vast majority of dollars invested in volatility oriented securities are bets that volatility will go up. Sometimes these bets are speculative, but more often they’re portfolio insurance. These long volatility bets have proved to be quite expensive—the holding costs are high.
Taking the other side of the deal—shorting volatility, or buying products that track daily inverse volatility is quite profitable most of the time, but when volatility spikes the losses can be heavy.
Consistent profits in inverse volatility are contingent on achieving these two goals:
- Be out when there are big volatility spikes
- Take advantage of the contango/time premium that drains value out of long volatility positions (75% to 80% of the time on average).
In September 2012 I found an inverse volatility strategy that looked promising for achieving these goals—it performed for almost a year after I posted it before it stopped working well.
The strategy uses ZIV, VelocityShares’ medium-term inverse volatility fund combined with the VIX/VIX3M ratio, an objective volatility measure, to switch between fully invested and cash. The backtest of this strategy starting at ZIV’s inception in 2010 is shown below:
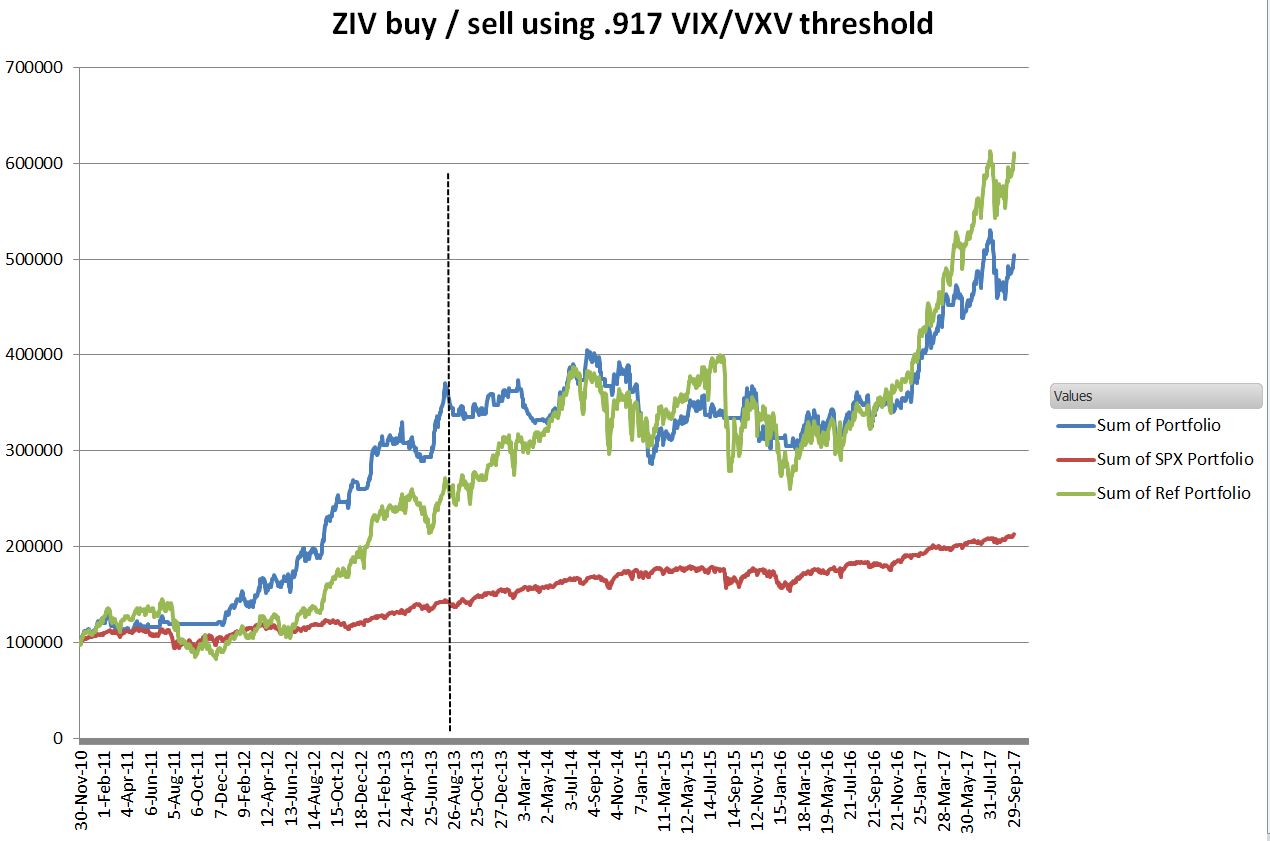
As of September 2012, the annualized gain was 70%, the maximum drawdown was 11%, and the Sharpe ratio was 9. The strategy switched allocations 41 times, or on average about once every two weeks. The blue line driven by the strategy, the green line is a simple buy-and-hold of ZIV, and the red line is the S&P 500.
ZIV takes an inverse position in 4 to 7 months VIX futures with daily rebalancing to maintain -1X tracking with the SPVXMTR medium term rolling index. This is essentially the index that Barclay’s popular VXZ medium-term volatility fund follows. Medium-term volatility funds are inherently less volatile than their short term cousins (XIV and SVXY).
While you’re probably familiar with the CBOE’s VIX index, the CBOE’s VIX3M (VXV) index is relatively unknown. It uses the same methodology as the VIX index, except it’s computed for a 3-month expectation of volatility on SPX options, instead of 1 month.
The VIX/VIX3M ratio gives a simple way to evaluate the 1 to 3-month SPX implied volatility term structure without caring about the absolute values of the indexes. For example, if the ratio is below one the term structure is in contango, otherwise, it is in backwardation.
The allocation scheme I used triggers a shift into cash when the VIX/VIX3M ratio is 0.917 or higher. In practice, this threshold is crossed when overall volatility is just beginning to pick up, or coming down after a long period of high volatility. A similar threshold (0.9) is used by Barclays’ XVZ dynamic volatility fund to trigger a shift from its largest short volatility position to a slightly less short portfolio. The chart below shows this threshold compared to the VIX index itself:

My initial backtest began in November 2010, but I was very curious what the earlier results of this strategy would have been, so it simulated this approach back to March 2004 using my ZIV backtest data. The results are shown below:
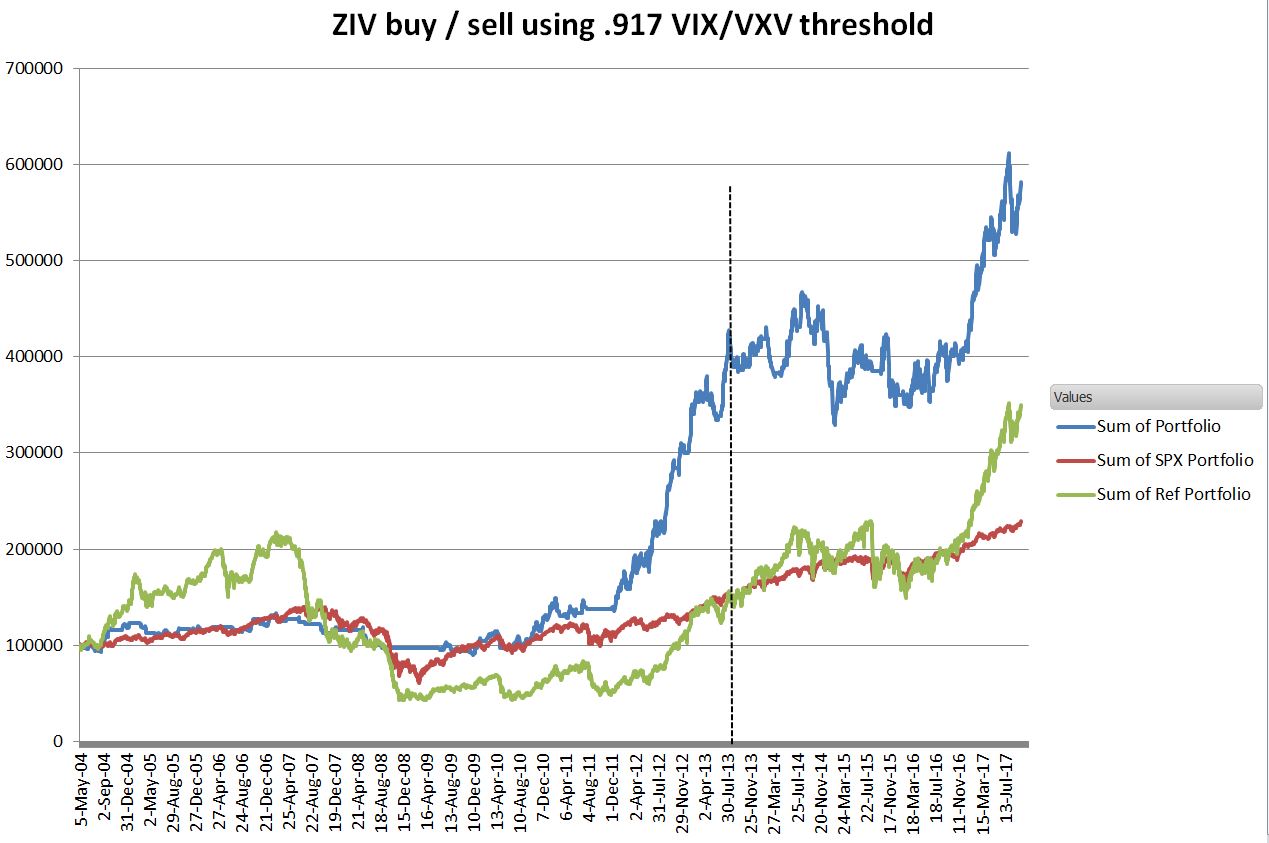
Obviously, something happened in 2010 that changed this strategy from going sidewise to 70% annualized growth.
It’s likely that something was medium-term contango. The medium VIX volatility term structure began steepening 2010 Increased levels of contango fuel this strategy.
With ZIV’s average daily volume running less than 80,000, and assets under management of around $170 million the liquidity pundits, will cry foul, but my opinion is that liquidity in an Exchange Traded Product is driven by the underlying rather than the fund itself. With VIX volatility futures setting weekly records of volume and open interest I don’t think liquidity will be a problem. The bid/ask spread tends to be around $0.05, or 0.15%, I’d prefer a penny of course, but I’ve gotten good fills on substantial orders at or within the spread.
As with any strategy, the past results do not guarantee the future results. In this case, the strategy worked well from September 2012 through November 2013, did not work well from December 2013 through June 2016, and then started working again in July 2016. This strategy was in cash on 5-Feb-2018 when the VIX spiked 116% and XIV crashed 96% (ZIV went down 23%) The VIX/VIX3M ratio went over .917 on 1-Feb-18 and stayed about that level until 8-Mar-2018.
Hi Vance, thanks a lot for the insights!
Now 4 year has passed since last update and we have seen many up and downs and panic period. I’m wondering can you update the strategy’s latest backtest result with SVIX and does it still works? Thanks!
Hi Jackson,
I don’t know if I will get around to updating the simulation, but I suspect the results would be pretty underwhelming. The method is quite good at avoiding the major disasters, the VIX/VIX3M threshold with 0.917 is quite conservative, but I suspect there was a lot of false alarms that didn’t clear until things had more than recovered. Also, between the Covid crash and the 2022 bear market there hasn’t been a much contango to go around.
Best Regards,
Vance
Hi Vance
You mentioned vix/vix3M stopped working for a few years as a trade indicator. Is vx1/vx2 (futures) a better indicator? So is the futures term structure a better indicator than the cash term structure?
Adam
Hi Adam,
I think the Vx1/Vx2 is an ok indicator but it has an eccentricity. Typically Vix futures have a premium to the VIX (unless things are pretty bearish) but the premium on VX1 tends to erode rapidly in the last week before expiration. This monthly nose drive decreases the VX1/VX2 ratio for the week before expiration pretty much independently from the state of the market. The VIX indicators, because they are constant horizon indicators, 30 and 93 days in VIX / VIX3M don’t have this wobble.
Vance
Hi Vance – I stumbled across this post and this is indeed a powerful signal. I created a RSI(14) of the vix/vix3m ratio and enter long SVXY when rsi crosses 50 down and exit when rsi crosses 50 above (i did not optimize just took 50).
the backtest produced a CAGR of 83% from 2011 as against buy and hold of 5%. The RSI will keep us in the market when backwardation reduces or when contago increases. It was also on the right side of the Feb-18 crash.
Hi Sudharshan,
Interesting approach. One advantage of the RSI approach is that it is probably insensitive to long term trends of the VIX/VIX3M ratio. I note here https://www.sixfigureinvesting.com/2020/01/historic-vix3m-data-back-to-1990/ that historically the ratio is on a long term trend.
Best Regards,
Vance
I have just started trading volatility and would like to thank you for your blogs, very helpful. Could you please tell me if this strategy comes out of the trade intraday should the ratio go over 0.917 at any point of the trading day or do you wait until near the close to see if the ratio will close over 0.917?
Vance, I really like this article and your website. The strategy is simple and works great. I’m wondering how the strategy performs after 2013?
Hi Mike,
Unfortunately it stopped working in mid 2013. This chart shows the later results. https://www.sixfigureinvesting.com/wp-content/uploads/2016/03/ZIV-simple-ratio-Dec2015.jpg
It appears that the amount of contango in the VIX futures drop some in the that timeframe, which might at least partially explain why it stopped working.
— Vance
Vance, thank you for your reply and update. I totally agree this strategy does suffer regime change due to the decreasing of roll-over return and VRP for ZIV.
Is it possible to update this strategy to hold ZIV when the ratio is lower than certain value and hold VXX when the ration is higher than certain value to take the advantage of the backwardation?
Hi Mike, My spreadsheet could be modified to do what you asked, but it’s not a priority for me. If you want to setup a project with me to do it you could have an appropriate spreadsheet to evaluate that strategy for around $150.
— Vance
Vance, thanks for the great article. Before reading this, I already made some gain by buying low during the 2011 high VIX period. But without a systematic way. It is hardly repeatable. This article open the door for a more systematic approach.
To thank you for the pioneering work, I would like to share some thoughts. Hopefully this can benefit more people.
Why the optimal ratio is 0.9 instead of 1?
Conceptually, 1 is the level to tell contango vs backwardation. However, your article points out 0.9 or 0.917 is the optimal level. Mike likes 0.93 . I did back tests. Anywhere from 0.9 to 0.94 could be good. If you plot the return as Y and ratio as X. It is not a smooth bell shape. That may due to how VIX spikes happen during the back test period. As a result, there is no single best ratio.
When the ratio is below 0.85, we can see the return drop pretty steadily. That is understandable, cause the number of days qualified also dropped. Like Jim Crammer said, you got to get into the game:) However, when I turn the ratio from 0.94 up to 1, the return also drop pretty steadily.
That confused me for a long time. Until one day, I tried to define a strategy to short VXX directly instead of buying XIV. By using the same ratio, but short VXX instead of long XIV. I found the optimal ratio is very close to 1. Even slightly high than 1 say 1.02.
In the following days, falling apples kept hitting my head. I noticed for the same VIX move, XIV and VXX move at different ratio. For example, July 31, Argentina defaulted. XIV droped 9.127% and VXX rised a 8.425%. That is 70bps difference. Given such difference, I back tested a simple long/short strategy. It generated 20+% yearly with almost no draw down. The Sharpe is so high, I would like to keep it as my little secrete.
Holy Grail, I found it!!!
BUT, it turns out to be a mirage. To short VXX, I got to borrow, or broker got to borrow for me. That is not free. If you check the fee rate for shorting VXX, you will quickly find out why there is no free lunch.
That finally cleared my confusion. XIV/ZIV are actually shorting the underlying security or a simulation basket. If shorting is free, the ratio would be 1. But give the fee, you have to focus on more lucrative days, which are those with lower ratio. For days with ratio between 0.94 and 1, you can still make money, but after fee, you will lose.
Hi Vance,
Would this indicator work on SVXY/XIV? i know it replicates the inverse of VXX, and it depends on front-month to back-month futures more than the ZIV.
Thanks!
Hi Mike, It works on SVXY/XIV also but the drawdowns are pretty severe. In 2013 the .917 threshold only captured around 50% of the gains. See attached chart. https://www.sixfigureinvesting.com/wp-content/uploads/2014/01/XIV-Vratio-jan2014.jpg
— Vance
Thanks for the reply Vance! I actually backtested it with XIV and i came up with 0.93 as the optimal ratio after throwing in data all the way to 2014. I applied a 10 day sma on the ratio data. but i feel like this ratio is a bit arbitary because it’s more of a “curve fitting” exercise. i bet if we added or deducted data from the sample it will change the optimal ratio. essentially this ratio is sort of giving us a heads up on whether the term structure is in contango or backwardation right? since we are taking VXV (3 month IV of SPX) vs. VIX (1 month IV), if it’s >1 we are likely to be in backwardation (M1 futures is likely to increase in price as we get closer to expiration).
Do you think it would a superior indicator to perhaps track the slope of actual term structure? (i.e, keep track of the difference between VIX spot and M1, then M2:M1, and perhaps M7 to M1 (entire slope of the term structure)? I wonder if that would make a more accurate indicator?
Hi Mike,
I agree that the underlying driver is backwardation / contango. Historically getting into backwardation or close to it is often associated with increased volatility–bad for inverse funds. I have looked closely at using the actual futures term structure or a surrogate instead of VIX/VXV. In my backtesting there wasn’t a significant advantage–the median behaviors are very close. In 2013 however I suspect the futures term structure would have worked significantly better. In 2013 the VIX completed its mean revision from the 2008/2009 peaks. This seemed to usher in a different choppier period. ZIV often made big jumps on days when the vix/vxv ratio was still high, but dropping rapidly.
— Vance
Does anyone know if it would work to buy UVXY when the vix/vxv ratio goes ABOVE .917? Or are you better off just holding cash?
Vance – this is one of my favorite articles. I come back to it all the time. Thanks for putting it out there. Right now, it sounds like you follow the ratio pretty religiously when combined with a little intuition. Two questions for you: 1) have you found any additional indicators that help eliminate false positives? 2) have you tinkered with entering and exiting at different levels? For example, exiting when above .90 and entering when below .917? Based on some trial and error / tinkering, I also use the $VIX 20-day moving average dropping below the 3% 10-day EMA envelope as a signal to exit SVXY.
Hi Mike,
With regards to other indicators the other thing I watch is the level of mid term contango. Normally it runs 2.5% to 3.5% per month, if it drops below that the term structure is getting flat and more susceptible to volatility up ticks. Won’t help you with SVXY..
I haven’t looked at different entry/exit points. It seems like the entries are often pretty clear. The only exception to that is if the previous day VIX/VXV ratio was pretty high (e.g., .95 to .97), then I would be inclined to wait a second day for confirmation. Exits tend to be messier, it’s hard to give up significant ground when the VIX/VXV gradually increases to .917, but I’ve seen it turn-around as many times as not and go on another profitable run.
Best Regards,
Vance
bill dobson 20 hours ago
Vance,Do you use stop orders on ZIV. Do you have a list of trade for you ZIV trades, It pretty simple based on a ratio. Have you tried anything else to improve result. May be use ATR stops or only trade if its in contango. Just wanted to get more of your thought. Its very thinly traded so would like to know what you think about placing stop and in case of a flash crash event.
Hi Bill,
No I don’t use stop orders on ZIV other than intra-day trades that I sometimes do. For my main positions I just monitor the VIX/VXV ratio.
Simplified List of Trades:
2012
4-Sept –> 26 Sept, 27-Sept –> 1- Oct
8-Oct –> 18-Oct, 12-Nov –> 3-Dec
13-Dec –> 20 Dec,
2013
2-Jan –> 25-Jan
5-Mar –> still in
I ignored the VIX/VXV ratio on my 13-Dec –> 20 Dec trade because I was pretty sure the fiscal cliff stuff would get resolved. Results have been pretty good with the simple system so I haven’t tried to tweak it. Intra-day moves on ZIV tend to be pretty wide, 1 to 2% is common.
The VIX/VXV < 0.917 is a strong contango indicator on SPX options, The term structure of the VIX futures usually quite close to the SPX version.
Spreads continue to be around 10 cents but volume has kicked up 10x since September and AUM by a factor of 4. I"ve not seen big orders move the spread, the underlying liquidity of the VIX futures is very good.
— Vance
Vance,
Where did you get your data from 2004-2005 for ZIV? The futures certainly weren’t there for many of the months and the mid-term index didn’t get started until 12/31/2005 as far as I can tell.
Just incorporates ZIV into my own program thanks to the recent pick-up in volume.
Thanks,
Pete
Hi Pete, I extrapolated/interpolated most of the missing futures data in 2004-2005 using the same algorithms documented in the index calc. For missing front month data I used a slightly modified extrapolation. From that futures data I computed the underlying mid-term index, and ZIV from that.
— Vance
Hi Vance,
Thanks for article. I have been tinkering with something similar after being inspired by some material posted over at marketsci. Could I ask, what entry and position sizing criteria are you using for your tests above?
Robert
Hi Robert, Regarding entry/exit criteria my simulation assumed an entry on close if the VIX/VXV is below 0.9 and exit on close if greater than or equal to 0.9. As far as size, the simulation is all in / all out. Not sure that’s what you need. Let me know if I didn’t answer your questions.
— Vance
Hi Vance, I have e-mailed you about my parameter-driven trend-following scheme based on historical data, but does a forward or out-of-sample test by stepping through the data one trade at a time and calculating the best parms on past data and then using them on “future” data for the next trade.
I’m wondering whether you might be able to do a similar thing here? E.g start with an arbitrary ratio for the first trade and when that trade exits, back test the data up to that point with various ratios, selecting the one that gives the best performance and using that on the next trade, and so on, recording the results obtained using out-of-sample data.
My apologies if this can’t be done with your method; I’m so ignorant of all of these volatility vehicles and data that I am unable to tell. I would just throw in my 2 cents’ worth that in all the testing I have done, an out-of-sample test is far more revealing than a back test.
Hi Frank,
I think your proposed approach does make sense in this case. Since I only have one parameter currently it would be significantly simpler than your 3 parameter case.
In this particular situation of medium term inverse volatility I think a structural change did happen in the market in the ’09/’10 timeframe–I suspect your proposed approach would really highlight that.
— Vance
I think you may see more promising results if you trade VXX and XIV based upon your VIX/VXV analysis. Essentially, this ratio says that the front end of the volatility term structure is in contango or backwardation. If you want to trade mid-term volatility ETFs, you might be better off looking at a mid-term over long-term implied volatility for your signals….or even better, the months that specifically impact ZIV.
Roll yield associated with volatility ETFs is particular to *very* specific points along the term structure. Just because the front end of the term structure is in backwardation, it doesn’t mean that the middle is still in contango (or vice versa).
Great article. I’ve looked at some of these inverse vol ETN’s as well as the alternative ETN’s – XVZ & VQT. I too have noticed the contango in the mid futures – this makes XVZ not a good bet now. ZIV is something active investors, not traders, should keep watch of.
Thanks. I’m still trying to make XVZ work because I’m using it to hedge some junk bond positions. It looks like a ZIV position that is about 25% of the dollar value of the XVZ position does a pretty good job of hedging out the contango losses. Have to pull the ZIV with the VIX/VXV ratio climbs above .9 however.
— Vance
Hi Vance, Very interesting article. I have been doing something similar. I was wondering if you tried other VIX:VXV ratios besides 0.9. This would be especially interesting for the earlier years when the 0.9 was not effective.
Hi Kapil, Yes I tried other values, but I focused on the last two years. What I found was that .9 was pretty close to optimal. If I went +-2% either way the returns dropped down significantly. That’s a good question about the earlier years I’ll take a look, but I suspect there isn’t much there for ZIV because of low contango, but the XIV performance might have been higher with a different ratio.
–Vance
Hi Vance, You mentioned that the returns dropped significantly with ratios other than .9 (.917). Were the returns under other ratios very low or negative, or was it a slow decline in each direction? I guess I am asking if the method is robust or is .917 the only ratio that seems to work?
Hi Kapil,
The 4th chart on this post https://www.sixfigureinvesting.com/2012/11/protecting-high-yield-bond-investments-with-vixvxv-based-timing/ shows return vs VIX/VXV ratio for JNK, but the ZIV results are very similar. The optimal ratio is different for each calendar year so the .917 was a compromise choice. I think anything between .9 and 1.0 would probably work ok. The hypothesis being that a steepening of the VIX style term structure right before it goes into a flat or backwardated shape is predictive of a market downswing.
— Vance
Good article, Vance.
The klinker in this rally-woodpile is VIX volatility, and this rally may be a house-of-cards.
About “The vast majority of dollars invested in volatility oriented securities are bets that volatility will go up,” if anyone is interested knowing how and when VIX volatility will change, Volatility Research has come up with a pretty good way to predict VIX “fear guage” volatility using NYSE VXX:
http://www.sites.google.com/site/VolatilityResearch/
We’re in the lull before the Perfect Storm.
Vance, based on reading your blog and others; I have devised a strategy similar to this but instead of looking at the term structure of SPX options, I am reading the term structure of VIX futures.
Thus, if you plot the VXX:VXZ ratio you will notice that it has a steady downtrend. Plot a moving average of that line (50 DMA) and you get a trigger line. When the VXX:VXZ ratio crosses over the moving average to start an uptrend, go to cash. Otherwise, ride XIV. Use Trailing stops on XIV to protect from those occasional drawdowns.Similar to your equity line, this strategy gets you out of XIV before those larger and longer market corrections. Like your chart, something happenned in 2010 to make this strategy a winner as the chart goes parabolic. It could be the polularity of Volatility ETFs or a market memory about the large 2008 drawdowns that is allowing this to work since 2010?
This ratio is also nice because it requires fewer trades…but probably has larger drawdowns.
Agreed. I forgot to mention that. This strategy has fewer trades so it’s great for swing traders and retail players with day jobs.
And since you are invested in XIV most of the time, you tend to be invested when we get the nice XIV pops like we had last week.
What I do not know yet is how well this strategy holds up to a true Black Swan event like a 911. Backtesting, it looks like it would have held up well during the 2010 flash crash and the Japan Tsunami.
I think the biggest risk to this strategy is something like a terrorist attack or natural disaster, that came without warning–although those would hit everybody that was long too. The VIX was pretty high before 911, so I suspect the VIX/VXV would have been above 0.9.
— Vance
Hi Marc, Interesting approach. I’ve stayed away from VXX: VXZ because it seemed like the contango would cloud the issue, but you’ve worked around that problem. I suspect something similar to the VIX/VXV approach would also work using the 1st and 3rd VIX futures. My opinion about the shift in 2010 is that it was probably a term structure shift due to the Volatility ETPs ramping up and impacting the longer term SPX option market.
— Vance
I found this article very interesting, but I can’t help by wonder what the results would be using XIV instead of ZIV with the same 0.9 VIX:VXV ratio. There is plenty of liquidity in XIV.
Hi,
The XIV return is pretty spectacular https://www.sixfigureinvesting.com/wp-content/uploads/2012/09/2004XIV.jpg ~ 5X gain over the 2010-2012 timeframe. Max drawdown was around 25%, so a significantly scarier down side.
— Vance
Can you reduce the turnover substantially by requiring more than one day of VIX/VXV>0.9? Or testing one day per week? Does this significantly impact performance?
Hi Andrew, I’d be really uncomfortable with a one day per week approach even if it backtested well. A lot can happen in a week.
I suspect waiting for two days of confirmation would probably be ok, I’ll try that in the simulation and see what happens. My plan is to assume that I’m going to get in or out as the case may be if the threshold is crossed, and then check my intuition for the final decision.
— Vance
” My simulation assumed an entry on close if the VIX/VXV is below 0.9 and exit on close if greater than or equal to 0.9. As far as size, the simulation is all in / all out.”
Vance,
Don’t you get a huge # of flip flops as the ratio sometimes shifts back and forth around 91.7%?
Hi cma6,
I haven’t updated the simulation in a long time ( I hope to update it soon), but I typically waited two days of above .917 before exiting. This reduced the churn quite a bit. At least in 2015 I don’t think there would have been a lot of switches,
— Vance
Can you post an updated chart for these strategies?