What Caused the Volatility “Volmageddon” on 5-Feb-2018?

In the afternoon of February 5th, 2018, what looked like a bad day for a group of high flying volatility-based products turned into a devastating decline.  Four factors combined to ruin their day: A Flawed Architecture Relying on the Past to Predict the Future Billions Under Management A Record-Breaking VIX® spike Twenty-five minutes before the close of the New York Stock exchange on February 5th, …

Read more

Using the VIX Futures Term Structure to Predict Volatility ETP Prices

Status quo forecasting is sometimes very easy to do.  For example, if you predict that tomorrow’s high temperature will be the same as today’s high, your estimate will be close to the actual high much of the time.  Predicting volatility Exchange Traded Products (ETP) prices is not so straightforward.

The VIX futures that volatility ETPs like VXX, SVXY, and UVXY track are similar to stock options in that they have a time value that usually decaying.  Generally the longer the VIX future has until expiration the higher its price.  If you plot VIX futures prices versus time until expiration the chart often looks like the one below from VIX Central.  This curve is called the VIX Futures Term Structure.

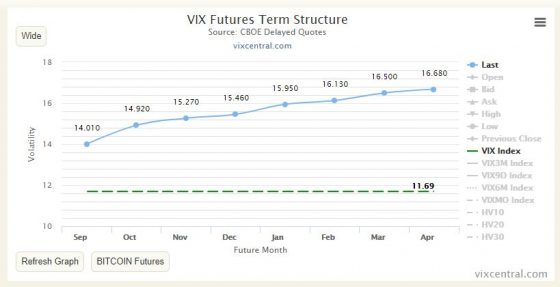
The term structure curve can be relatively stable for significant periods of time—which raises the question of whether we can use the term structure to predict volatility ETP prices.

Even if the price vs time curve of the VIX Futures stays exactly the same, several underlying factors that impact the prices of the volatility ETPs are in a state of change.  For example:

  • The individual VIX future’s prices change as they approach expiration
  • The mix of VIX futures that determines the ETP values changes based on their time to expiration and their prices
  • The position size of VIX Futures held by the leveraged ETPs (e.g.,  UVXY, SVXY) changes on a daily basis based on the previous day’s percentage moves

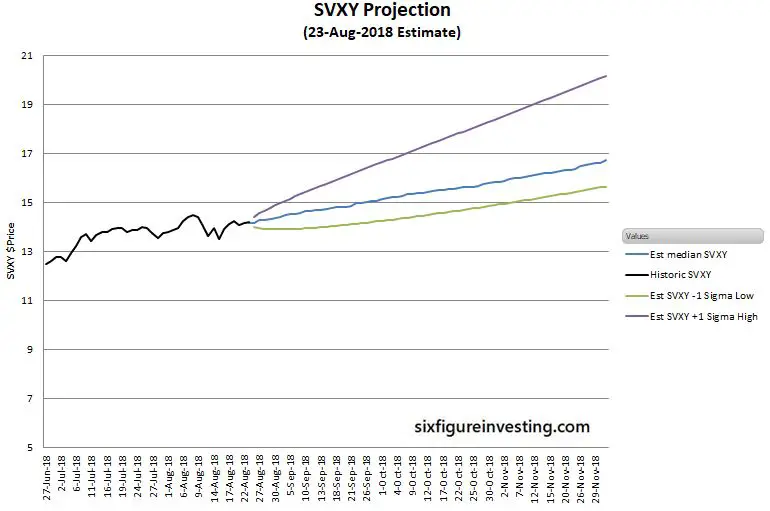
Assuming the VIX futures term structure is stable (including the Cboe’s VIX spot price) allows us to project how much decay/gain is “built-in” to the prices of the long/inverse volatility ETPs. This information can help us set strike prices for option strategies, set limit prices, and determine risk/reward parameters.  More than 80% of the time, the VIX Future Term Structure is in a configuration called contango, where futures with more time until expiration are priced higher than the “spot” VIX price.  While in contango, decay factors on long volatility funds like VXX and UVXY can be considerable as can the boost factors on inverse funds like SVXY.

Read more

Volatility ETP Price Projection Service

I am offering a Volatility ETP Projection Service that calculates future volatility Exchange Traded Product (ETP) prices assuming the current VIX futures term structure is stable.

In my post Using the VIX Futures Term Structure to Predict Volatility ETP Prices, I show how this approach can be used to produce statistically valid ETP price projections and ranges.

This forecast does not attempt to predict upcoming volatility spikes or slumps—it’s totally focused on the price trends that would occur with a static VIX futures term structure.

With a stable term structure (and a stable spot VIX), the VIX futures prices that underlie the volatility ETPs like VXX, VXXB, UVXY, and SVXY do change but they precisely follow the price/days-til-expiration curve.  The VIX Central chart below shows the closing VIX futures prices for August 23, 2018.  If the term structure is stable then the curve at the end of the 24th would have the identical price vs time shape but the blue data points, representing futures values, would all be shifted slightly down and to the left.

The VIX futures that underlie the volatility ETP are volatile creatures—tomorrow’s values can be dramatically different than today.  I’m not trying to predict those sorts of changes.  What I am computing is the decay or boost that the volatility ETPs experience if the term structure stays in a stable contango or backwardation configuration.  This calculation is not an easy problem—there are a lot of moving parts even when the market is stable.

Historically the VIX futures term structure has been in a contango configuration 80%+ of the time.  Contango fuels a situation where the long volatility ETPs like VXX, UVXY, or TVIX suffer from high decay factors.  Anyone that’s looked at their long-term charts will see the massive impact of those decays over the long run.

Because of the typical decay in long volatility products, short volatility trades are popular but the possibility of volatility spikes makes risk management an important concern.  By estimating median prices and +-1 sigma ranges traders have some analytical results that can help quantify payoffs and establish appropriate risk management thresholds.

The chart below shows a typical SVXY projection when the term structure has been in contango for a while.

Read more

How Does VMIN Work?

Update

On September 26, 2018 REX ETF shutdown VMIN. See this link for the newsrelease.  The 2018 market was not friendly to short volatility products and VMIN never recovered its asset base after the 5-Feb-18 Volatility Tsunami.

March 2018 Update 

As of March 7th, 2018 VMIN will shift its trading strategy to use longer-term VIX futures with 3 to 5 months until expiration in addition to it holdings of short term volatility Exchange Traded Funds.  I’m estimating that this new strategy will result in a leverage factor of around -0.53X of the short term index futures index SPVXSTR that VXX is based on. This change was likely in response to the events of February 5th, 2018 when a massive VIX futures spike occurred in the last 30 minutes of trading. This change to VMIN will make it less susceptible to a termination event if VIX futures were to increase 100% or more from the previous day’s close.  This leverage change will likely reduce VMIN’s performance when VIX futures are in contango and reduce its price decreases when VIX futures fall.  I have not updated the content of the post below to reflect the strategy—I will when the details of the change become clearer.  REX ETF Press Release

———————————————————————————————————————————————————————————

In May of 2016, REX Exchange Traded Funds introduced two volatility oriented products, VMIN and VMAX.  One is a bet on market volatility staying the same or dropping (VMIN) and VMAX is essentially its mirror image—betting on short term volatility increases. VMIN has some important structural and performance related differences that distinguish it from the other short term inverse volatility funds—VelocityShares’ XIV and ProShares’ SVXY.

In this post I focus on VMIN’s differences from its competitors. If you are new to inverse volatility investing I suggest you review the fundamentals by reading How does SVXY Work?

For a good understanding of  VMIN (full name: REX VolMAXX™ Short VIX Weekly Futures Strategy ETF) you need to know how it differs from other inverse volatility funds, what it tracks, its risks to the investor, and how well it has performed.

How Is VMIN Different From a Performance / Tax Standpoint?

  • Far from being a “me-too” product, VMIN differs from its SVXY and ZIV competitors in a number of important ways. One key difference is that VMIN is designed to track the daily moves of the CBOE’s VIX® better than existing securities. VMIN is an inverse fund, so it generally moves in the opposite direction of the VIX.
  • In addition to this improved tracking, VMIN also outperforms its competitors in taking advantage of the structural drag of VIX futures when their term structure is in contango. Contango exists when longer-dated VIX futures are priced higher than VIX futures that have less time until expiration. The VIX futures that underlie the volatility Exchange Traded Products (ETPs) are in contango around 75% of the time. In the May 2016 to March 2017 time period, VMIN outperformed its completion by 28% due to this characteristic, more than tripling during that period. In fact, VMIN was the best performing fund in the ETP universe in the first quarter of 2017, outperforming all other 23,788 funds, with a 35% gain.
  • While VMIN is an Exchange Traded Fund (ETF) like SVXY, its tax reporting is the same as an ordinary equity investment with your short and long-term capital gains reported via 1099 forms. Because SVXY holds VIX futures directly tax laws require that it be treated as a partnership, reporting gains/losses via Schedule K-1 forms. While not a huge deal; K-1 forms are complicated and always seem to arrive very late in the spring.
  • VMIN will make distributions of any realized securities gains at least once a year. In a good year this special dividend will likely be substantial (for FY 2016 it was $9.92/share). Neither XIV nor SVXY distributes capital gains this way—they have different legal structures (Exchange Traded Note and an ETF structured under the Securities act of 1933 respectively). Special dividends from VMIN or VMAX will be taxed as ordinary income.

Read more

Is Shorting UVIX, UVXY, or VXX the Perfect Trade?

Long term charts of 2X UVIX, 1.5X UVXY, or VXX suggest they are perfect candidates for shorting, but there are risks you should be aware of and alternatives to consider. The charts for long volatility Exchange Traded Products (ETP) like Volatility Shares’ UVIX, Barclays’s VXX, and ProShares’ 1.5X levered UVXY are astonishing. I’m not aware of any other widely available securities that have declined like …

Read more