The Cboe’s VIX® (30-day) and VIX3M (93-day) indexes enable us to quantify volatility term structures but until now, historical analyses between VIX style indexes have been limited to dates after December 2001. This post introduces the results of VIX3M style calculations back to 1990, and reviews issues and trends that were revealed.
In November 2007, the Cboe introduced VIX3M, a volatility index that uses the same basic methodology as the VIX but with a 3-month time horizon (specifically 93-day) instead of the VIX’s 30 days. Initially introduced as the VXV index and renamed to VIX3M in 2017, the Cboe might have been planning to offer futures based on this new index. That hasn’t happened but we gained a very useful second data point on the volatility term structure of SPX (S&P 500) options. Term structures reflect how commodity/security prices change over a time horizon. For example, the price of a corn future that delivers at harvest time will likely be lower than prices for delivery at other times of the year. That low point reflects the willingness of sellers at harvest time to accept a discounted price rather than put corn into storage.
Volatility term structures offer a view of volatility expectations over time—one that’s relatively insensitive to the absolute levels of volatility. Interpreting a volatility level by itself is tricky. Just knowing the VIX is at, say, 20 today doesn’t give you as much information about the market as you might think. For example, if the VIX was at 13 two weeks ago and today’s VIX is at 20 it suggests a nervous market, but if it was higher, e.g., 35 two weeks ago then that same level of 20 today indicates the market is breathing a sigh of relief. In the first case, there’s been a major volatility upswing and the market is probably still jumpy; the second situation implies volatility is collapsing as the market relaxes.
Combining the VIX3M with the VIX gives us two data points on the volatility term structure, enabling us to differentiate between these two market moods in real-time. The Cboe added three more VIX style indexes after the VIX3M, the 9-day VIX9D, the six month VIX6M, and the one year VIX1Y to flesh out the VIX volatility term structure. The chart below shows the VIX volatility term structure as of January 21st, 2020.
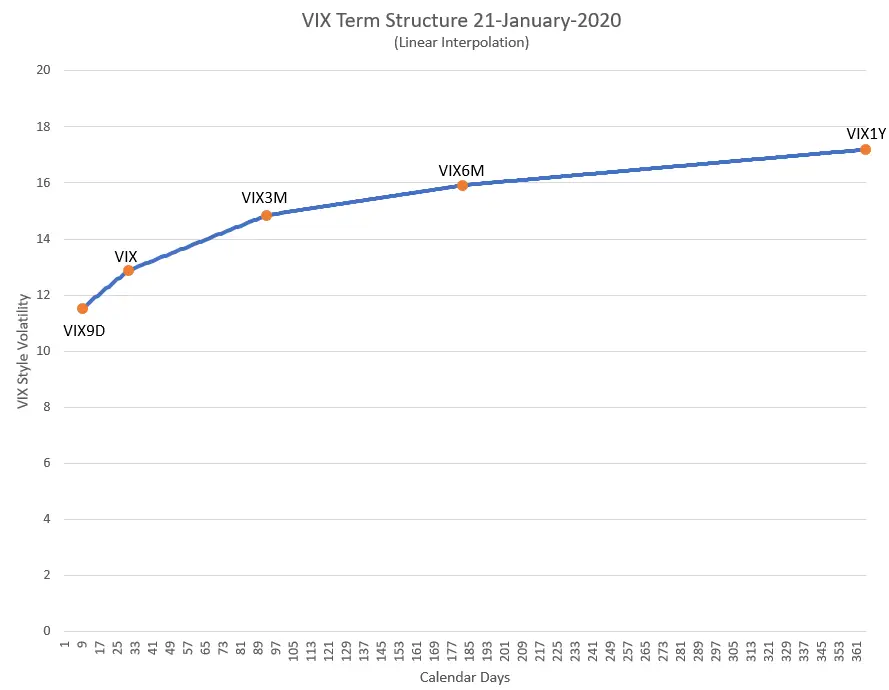
Often the relationship between VIX and VIX3M is expressed as a ratio. The VIX’s level divided by VIX3M’s gives us a term structure metric. Levels below 0.9 indicate a calm market and levels above 0.95 suggest a market in turmoil.
VIX3M Historical Data Starting January 2002
The Cboe has calculated VIX3M values starting in 2002 (their VIX data starts in 1990). I’ve been curious for a long time as to how the VIX3M behaved before 2002 and I finally followed through and calculated 93-day volatility levels, using the VIX methodology and historic SPX options data back to 1990. The rest of this post describes the specifics of the calculation and analysis of the results. These results are not official VIX3M values. Here, and at the end of the post, there is a link to purchase a spreadsheet that incorporates my results along with the Cboe’s from 1990 through 2019. I have also done a similar calculation for VIX6M, for information on that see this post.
Why no pre-2002 Cboe data?
Before going through the work of calculating the 1990 through 2009 values, I reviewed the SPX option historical data to see if there were any structural reasons that prevented the Cboe from back-calculating the VIX3M before 2-January-2002. For example, did an appropriate option series exist, and were there enough strikes listed to do a meaningful calculation? Checking the data for the first day, 2-January-1990, I found that there were suitable options series with expirations of 16-May-1990 and 15-Jun-1990 that straddled the 93-day time horizon desired, with 34 and 32 options listed respectively. This seemed adequate and the appropriate calculations on these options, yielded a result of 19.08, a reasonable 93-day value for a day when the VIX was at 17.24.
Not surprisingly, when calculating the following 3024 trading days there were additional issues but fortunately, no showstoppers. The biggest problem was a 3-month stretch during a sustained bull market (19-Sept-1995 to 20-Dec-1995) when the SPX index was trading at or above the highest strike price available on the listed options. Evidently, the Cboe did not issue additional strikes on the existing option series during that period. The VIX style calculation becomes unreliable or breaks if you don’t have options strikes that straddle the SPX index’s current value. The details of how this and other issues were addressed are covered in the Problematic Days section below.
How is the VIX3M calculated
The VIX3M uses the same basic methodology as the VIX, except the time horizon is 93 days instead of 30. There are three fundamental steps to the calculation:
- Select options series with expirations that straddle the desired time horizon.
- Compute the implied variance for each of these series using selected put and call prices and appropriate interest rates.
- Do a variance interpolation to calculate 93-day variance and then convert to volatility.
For more information see the Cboe’s VIX White Paper, the CBOE’s VIX3M Methodology, and my post Calculating the VIX, the Easy Part.
Differences between the Cboe’s VIX3M Calculation and Mine (VIX3M-SFI)
- The closest option series to the target time horizon were not always the ones used. If the closest series didn’t have at least 20 combined puts and calls I observed that the calculation resulted in an overly high value within the historical context. In those cases using the next available monthly series further away from the target time horizon returned a much more reasonable result.
- USA treasury interest rates were linearly interpolated rather than doing the cubic-spline approximation the Cboe uses because I suspected the results would not be materially impacted by using the simpler approach. Later in the post, I discuss how I validated that assumption.
Comparing My Results With The Cboe’s 2-Jan-2002 through 26-Feb-2010
To validate the calculations, the results from 2-Jan-2002 to 26-Feb-2010 were compared to the Cboe’s values. The results expressed graphically are shown in the next chart:
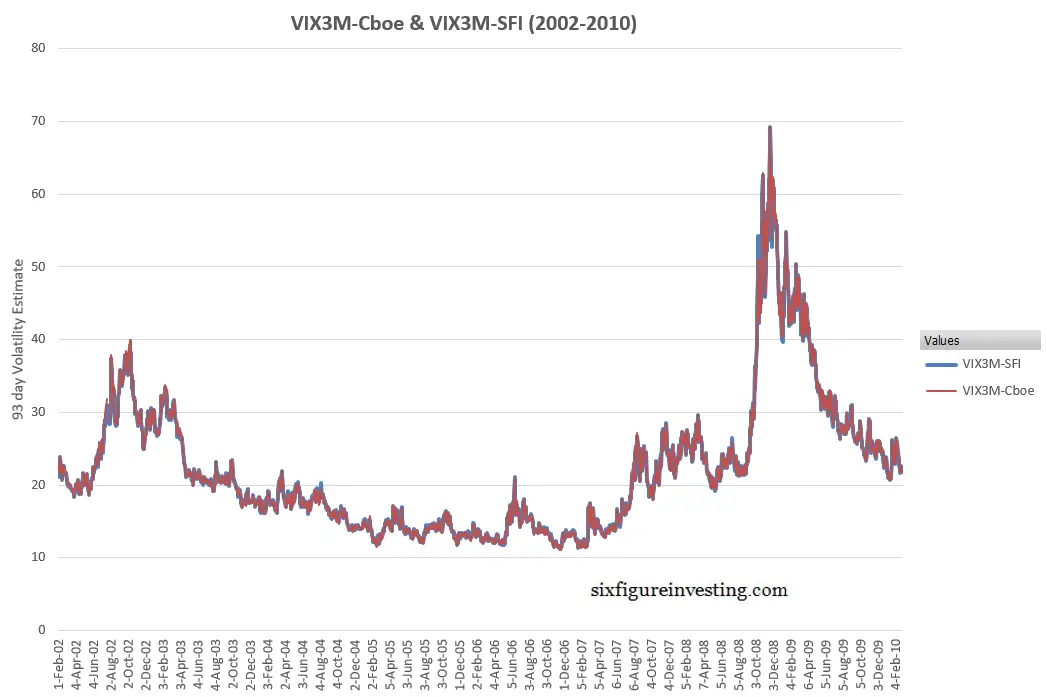
Close but not identical.
The median daily difference is 0.08% and the standard deviation of differences was 0.9%. The next histogram shows the distribution of percentage differences between the two sets of VIX3M style calculations:
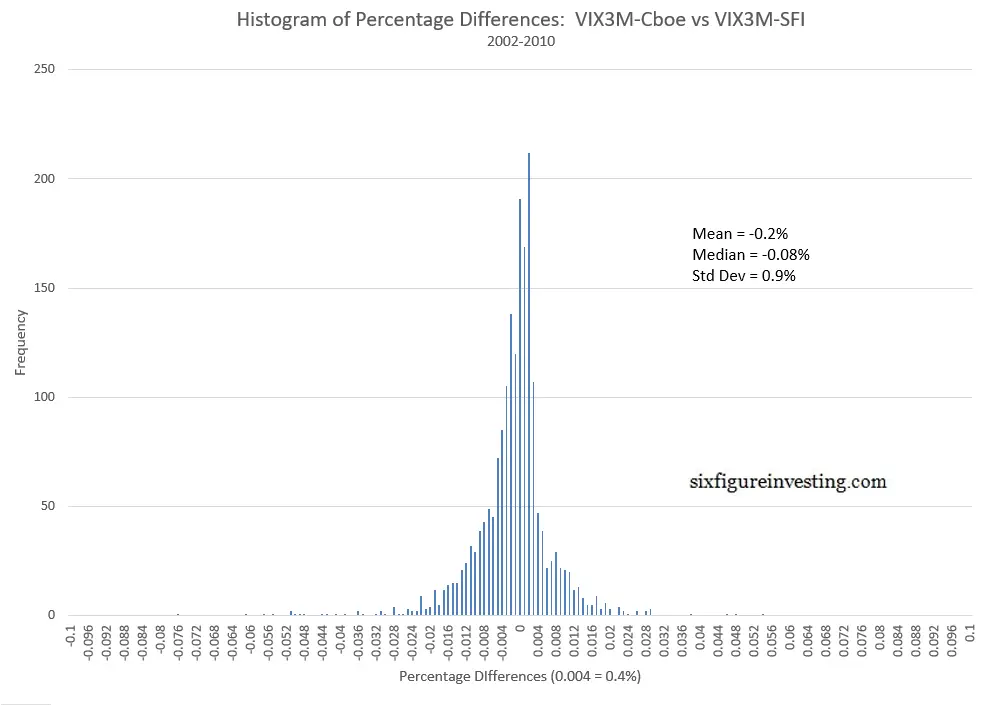
Zooming in on the low end of the vertical scale of this histogram we see a fair number of high sigma deviations on the positive and negative sides.
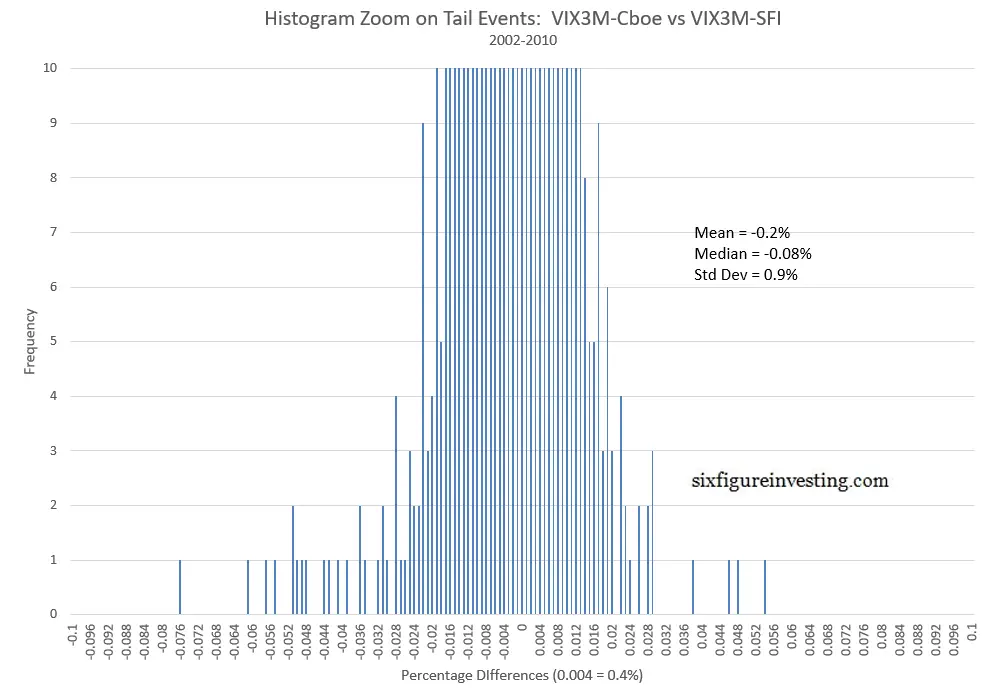
There are 17 days with differences greater than +-4 sigma. Many of the large negative differences (where the Cboe’s values are higher than the VIX3M-SFI results) occurred in October 2008, a month where the S&P 500 dropped 16.8%. I purchased SPX options data ($17) from the Cboe’s DataShop for that month to determine if I had data integrity issues. The differences changed only slightly, if at all. Further analysis revealed that all the high sigma differences occurred on very volatile days. For example, the largest difference between my result and the Cboe’s (-7.6%) was on 24-October-2008, a day that the VIX spiked from an opening value of 67.03 to a high of 89.53. At 4 p.m. ET the VIX had dropped to almost flat for the day at 67.80 but then in the next 15 minutes rebounded over 16% to 79.13!
The Cboe establishes the VIX3M’s end-of-day value at 4:15 p.m. ET. When the VIX3M-SFI results significantly differ from the Cboe’s VIX3M I believe it’s because the end-of-data SPX data available for purchase is a 4 p.m. snapshot whereas the Cboe uses SPX option values at 4:15 p.m. ET for their calculations. An end-of-day surge or collapse in volatility is likely the root cause of the occasional high sigma differences between the Cboe’s and my results.
As a first pass check to see if the linear interpolation approach used for estimating Treasury interest rates was appropriate, I set the interest rates to zero for the entire comparison period and reran the calculations. The median error only increased from -0.08% to -0.19%, so it seems safe to say that interest rates are not a significant error factor in the VIX3M calculations.
Problematic Days January 1990 through January 2002
The VIX3M style calculations failed (trying to take the square root of a negative number) on August 24th, 1992 and ten days in December 1995. As mentioned earlier, this was due to the lack of options with strikes above the SPX index level on those days. In the period immediately preceding the December 1995 failures, 19-Sep-1995 to 1-Dec-1995, the calculations didn’t fail but were suspect because these days had a very limited number of strikes above the SPX index level.
Rather than leave that period blank, I employed my “simple” model for VIX future’s prices to extrapolate a 93-day volatility value using the historic VIX values for that period. As the chart below illustrates, the simple model approach (red line) generates VIX3M style values for that Fall 1995 period that are much more reasonable than the suspect SPX option derived values.
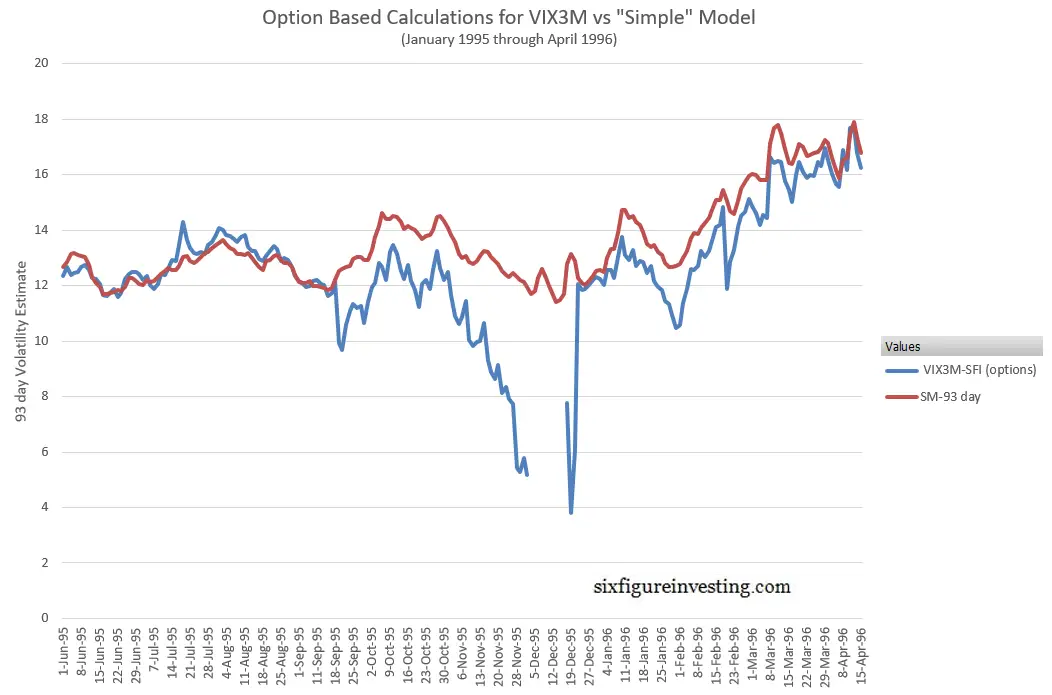
The simple model was also used to provide a value for August 24th, 1992.
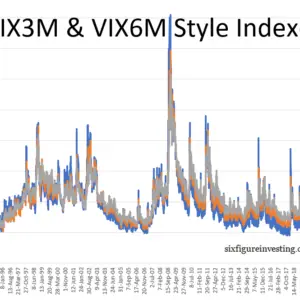
Characteristics of the VIX3M from 1990 through 2019
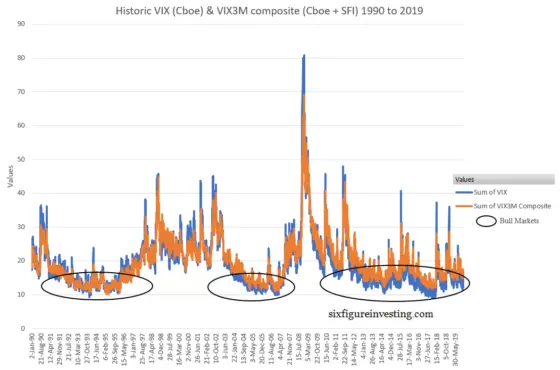
The combined results of my VIX3M-SFI calculations together with the Cboe’s creates a 30-year series that matches the time span of the historic VIX dataset. Looking at the chart below you can see that the VIX has consistently spiked higher than the VIX3M during panicky periods, and while the VIX frequently drops below the value of VIX3M during quiet times, it appears that the extent of this behavior has shifted over time. As indicated below, the amount of blue (VIX) below the VIX3M concentrations during bull markets has increased over the last 3 decades.
Experimenting with various ways of quantifying this behavior I found that plotting the minimum and maximum values of a rolling 30 trading day sample of VIX/VIX3M values worked well. The resultant chart looks like this:
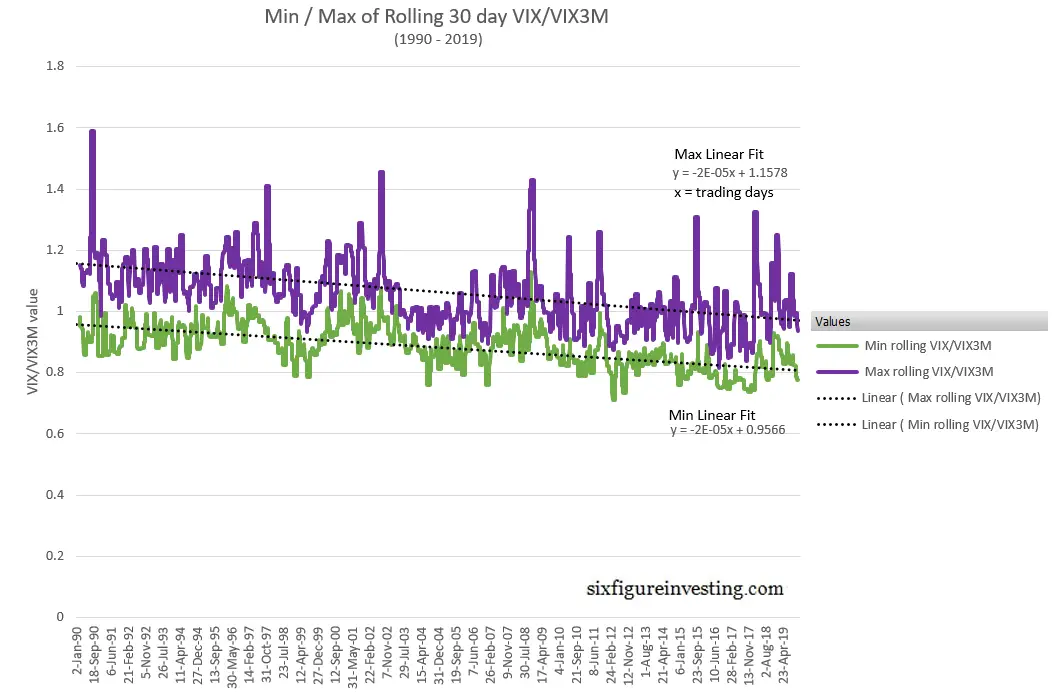
This trend in the VIX/VIX3M ratio is due to changes in both the VIX and VIX3M behavior’s, illustrated in the next chart, with the VIX’s intra-decade lows dropping around 5% per decade and the VIX3M’s intra-decade lows increasing by about the same percentage.
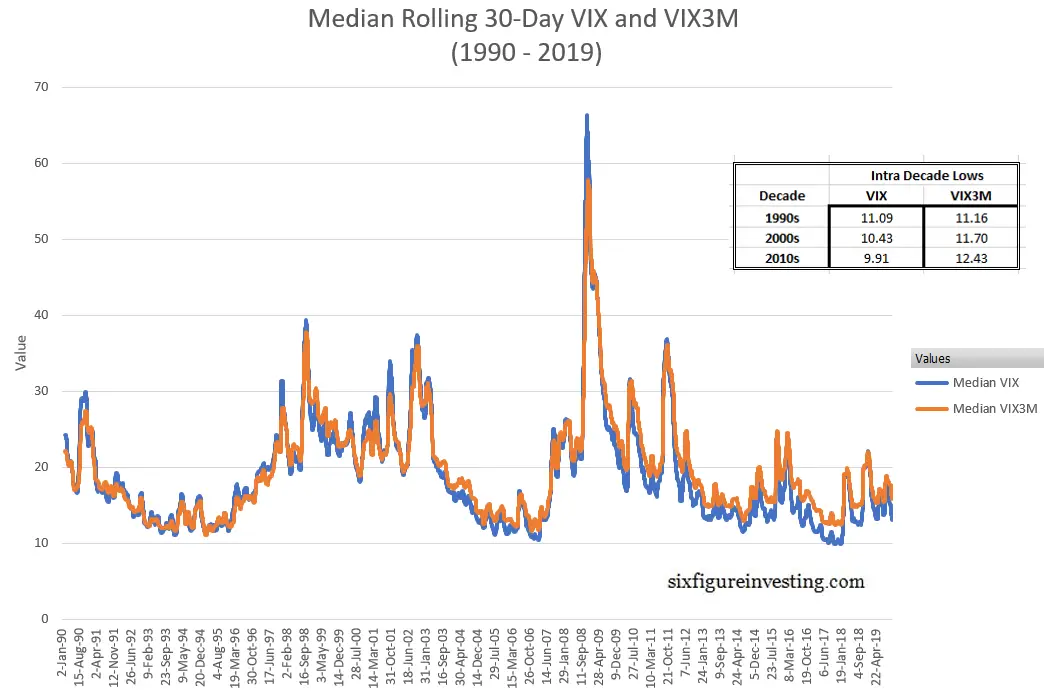
Whether this trend will continue is anybody’s guess but these charts make it clear that VIX term structure is not static within the context of repeating bull/bear markets—there’s been a 30-year steepening trend in the term structure. Other than the simplistic observation that SPX options with about 3 months until expiration have become relatively more expensive than SPX options with about a month to go, it’s tough to say what’s causing this trend with high confidence. It could be that volatility sellers are moving shorter term to harvest more premium or alternately, institutions are shifting their purchases of protective puts to longer time frames.
Conclusion
Access to historic data is a multi-dimensional risk/opportunity. It can challenge or confirm our assumptions, enable us to quantify trends/behaviors that we intuited but couldn’t formalize, or lure us into overfitting. User beware.
Please click on the product information below if you are interested in purchasing the daily values of VIX3M style calculations back to January 2, 1990.
Is the (Vix/Vix3M) ratio a better indicator for trading Vol ETF’s than (VX-front month/VX-back month) ratio? And why?
The thing I don’t like about the VX front vs VX back ration is that in addition to reflecting the term structure also reflects the dynamics in the decay in the spread between the front month future and the VIX. That spread tends to stay fairly stable until around a week before expiration, but then the future often starts to close in on the VIX’s value. This adds another dynamic to that ratio which I think muddles its effectiveness. One future based ratio that I do like is the VX30/VX90 ratio, which essentially interpolates the current composite futures term structure to determine what the effective 30 & 90 day futures values were.
Very good work! I’ve wondered that VIX3M would have looked like in the 90s as well.
I would appear that shorting VX30 when VIX<VXV basic rule would have been more challenging pre-Fed rate cuts prior to 2001. Fundamentally, mid to late 90's environment was characterized by higher steady vol that came from high valuations towards the top of the S&P 500. Though more extreme, not too unlike today. I worry about the short vol trade going forward. Isn't enough to get good signaling, we need some steep contango for a good duration of the trade.
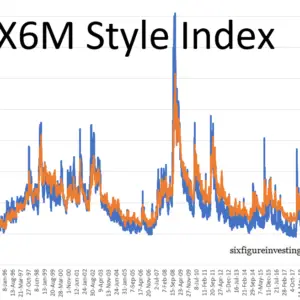
Very nice. Do you have any plans for extending the 6 month as well?
Also, you mentioned “The Cboe has calculated VIX3M values starting in 2002 …”
I didn’t see that on the CBOE site, just their data starting 12/4/2007.
Is the VIX3M data back to 2002 publicly available or would I need to buy your package calculating it back to 1990?
Thank you.
Hi Alan, I do plan to offer VIX6M also, probably in Feb 2020. I’ll offer a VIX3M + VIX6M combo probably for $225. I’ll offer purchasers that bought the VIX3M a discount to buy the VIM6M for an additional $75. To my knowledge, the Cboe’s pre-December 2007 VIX3M data is not available for free.
Best Regards,
Vance
Hi Alan, VIX6M data is now available. Pos: https://www.sixfigureinvesting.com/2020/02/historic-vix6m-data-back-to-1990
Product info:
https://www.sixfigureinvesting.com/product/vix3m-and-vix6m-style-index-calculations-back-to-1990/
Best Regards, Vance
“It could be that volatility sellers are moving shorter term to harvest more premium or alternately, institutions are shifting their purchases of protective puts to longer time frames.”
or that the people doing the put selling are the institutions, which are no longer buying protective puts for their index holdings, but are SELLING short-dated puts as a substitute for getting long the index part of their portfolios whilst simultaneously harvesting the volatility risk premium
Great contribution thanks,
Would it be possible to have the date when the curve was inversed (Vix higher than VIX3M) in the pre-2002 period?
Kind regards
Hi Damien,
Sorry, I put a lot of work into generating this data. I’m not going to give it away. You can purchase the product here: https://www.sixfigureinvesting.com/product/vix3m-style-index-calculation-back-to-1990/
Best Regards,
Vance