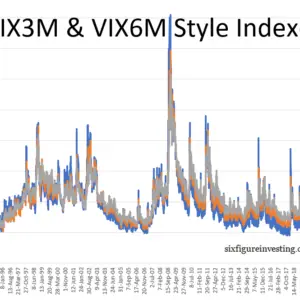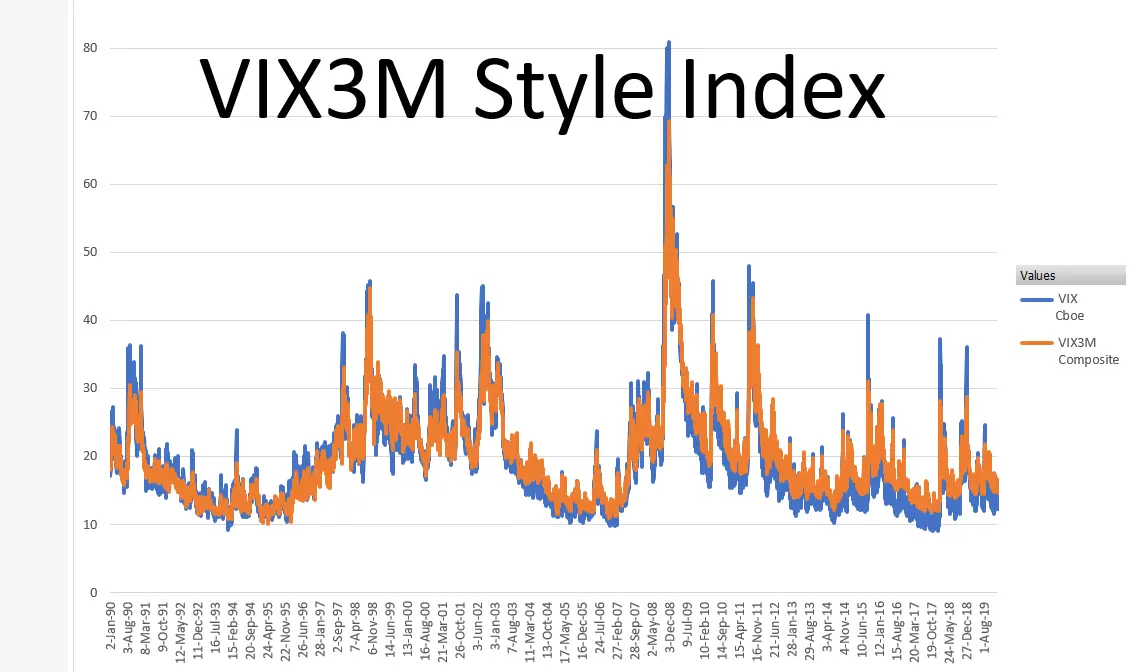
VIX3M Style Index Calculation Back to 1990
$149.00
Description
The VIX3M is a Cboe VIX® style index, which uses the VIX style calculation methodology but has a 93-day horizon instead of the VIX’s 30-day outlook. The VIX3M was introduced by the Cboe in 2017 (it was named VXV at that point) and did the appropriate calculations back to January 2002. I have taken the SPX option historical option and US treasury data and used the VIX3M methodology to compute VIX3M style results back to January 2nd, 1990–adding 12 years of daily close historical data. For details on this calculation, difference analysis, and long term trend analysis see Calculating a VIX3M style index back to 1990.
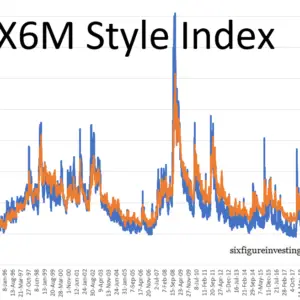
I also offer a VIX6M style result back to January 1990 and a VIX3M + VIX6M combo at a discount.
The VIX3M style results are available in a spreadsheet that includes:
- Composite VIX3M that includes my VIX3M style calculations merged with Cboe data (giving Cboe data priority) starting January 1990. The indexes are updated through at least April 2023 (see this table for specific dates). My data is the day end close (4 pm ET) value only.
- The Cboe’s VIX data starting on January 2nd, 1990
- My stand-alone VIX3M style calculations from January 2nd, 1990 through February 26th, 2010 (I computed 9 years of data where Cboe data was already available to validate my calculations)
- The VIX/VIX3M ratio from January 2nd, 1990
- Thirty-day rolling min/max values for VIX/VIX3M (useful for evaluating long term trends in volatility)
The spreadsheet does not include the data or any of the formulas that were used to compute the VIX3M values, however, it does include formulas to make it easy to update the VIX and VIX3M composite data by importing the publicly available updated spreadsheets provided by the Cboe (VIX, VIX3M).
I also offer a quarterly update service for this spreadsheet. For more information see https://www.sixfigureinvesting.com/2011/02/quarterly-update-service/
My calculations typically do not exactly match the Cboe’s results on the days when both results are available (January 2nd, 2002 through Feb 26th, 2010), the median difference is 0.08% and the standard deviation of differences 0.9% is so the results are usually very close, however, there are 20 days with differences larger than +-3% which occurred on very volatile days. I discuss the root cause of these differences in Calculating a VIX3M style index back to 1990.