Update
In August 2016 UBS terminated VQTS. UBS wasn’t particularly patient with the fund, it had only been operational since December 4th, 2014, but it never gained much in the way of assets. As you can see below VQTS was a complex fund driven by factors that historically seemed to be good predictors of future market action, but like most funds that use backtested strategies they tend to perform poorly once they are introduced. My post mortem on VQTS is that took a day or two longer than necessary to switch assets, even when its signals had triggered, causing it to get whipsawed in choppy markets. In addition, its term structure indicator, based on VIX futures rather than the more common VIX/VXV ratio had a severe time dependency in it—it did not account for the dynamics of the front month futures nearing expiration. A time-weighted approach, adjusting the futures values to a constant time until expiration would have probably been a better indicator.
______________________________________________________________________________
VQTS is an exchange-traded product that that attempts to solve the essential conundrum of the stock market: how to run with the bulls without getting mauled by the bears.
The algorithms in VQTS are tuned to outperform the other hybrid volatility funds like Barclays’ VQT and VelocityShares’ SPXH during good times and to be competitive during the bad times.
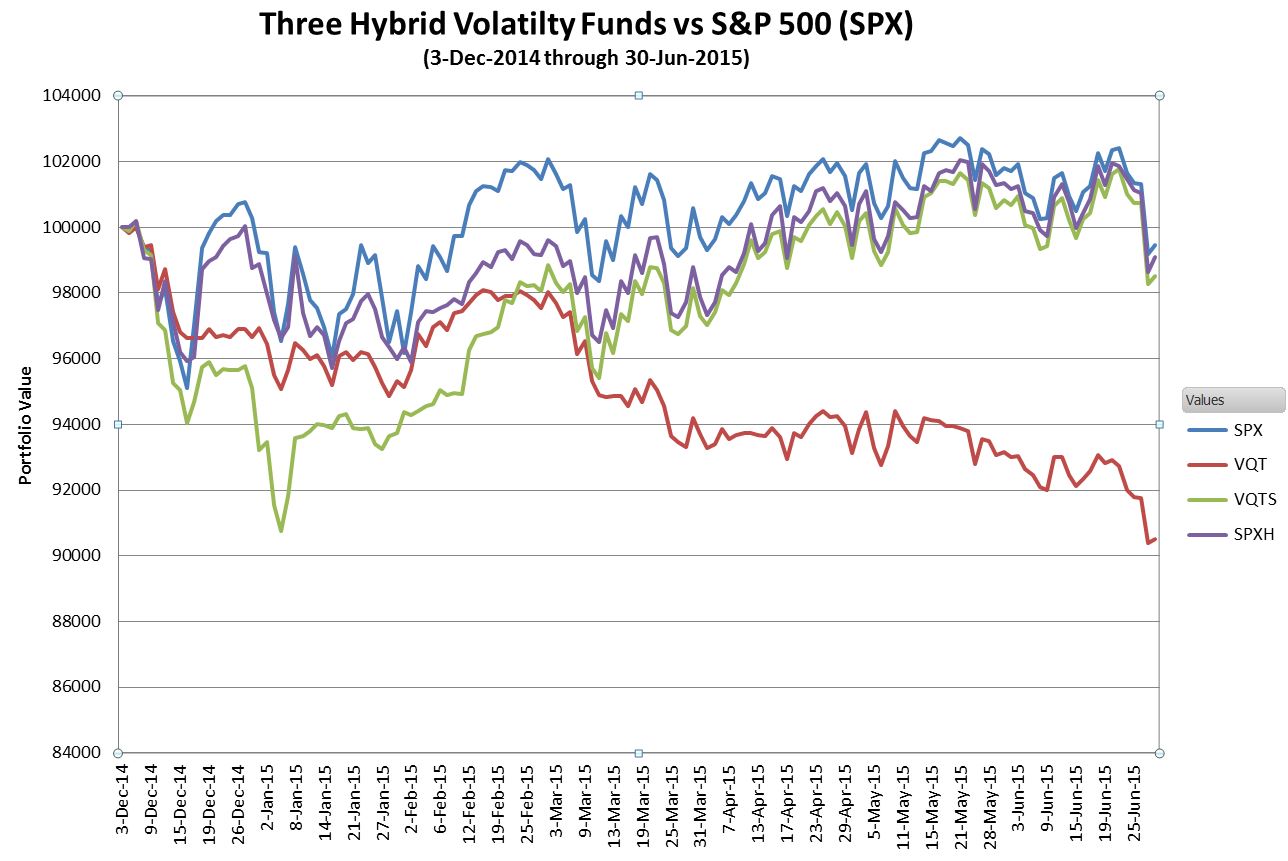
We don’t have much trade data since UBS only introduced VQTS on December 3rd, 2014. It stumbled in its first month of trading, but then recovered during the first half of 2015—but after 8 months it is only lagging SPX by 0.5% since its inception.
All of the hybrid volatility funds dynamically allocate assets into the S&P 500 (SPX), VIX futures, and cash depending on market conditions. VQTS is the first fund of this type that invests essentially all of its assets into the S&P 500 when the market’s overall volatility is low. This avoids the costs of hedging when the market is least likely to go down—during the long upward stretches of bull markets. In comparison, two similar funds, Barclays’ VQT and PowerShares’ PHDG both have at least 2.5% of their assets allocated to long volatility—and that small amount significantly drags down their returns during bull markets.
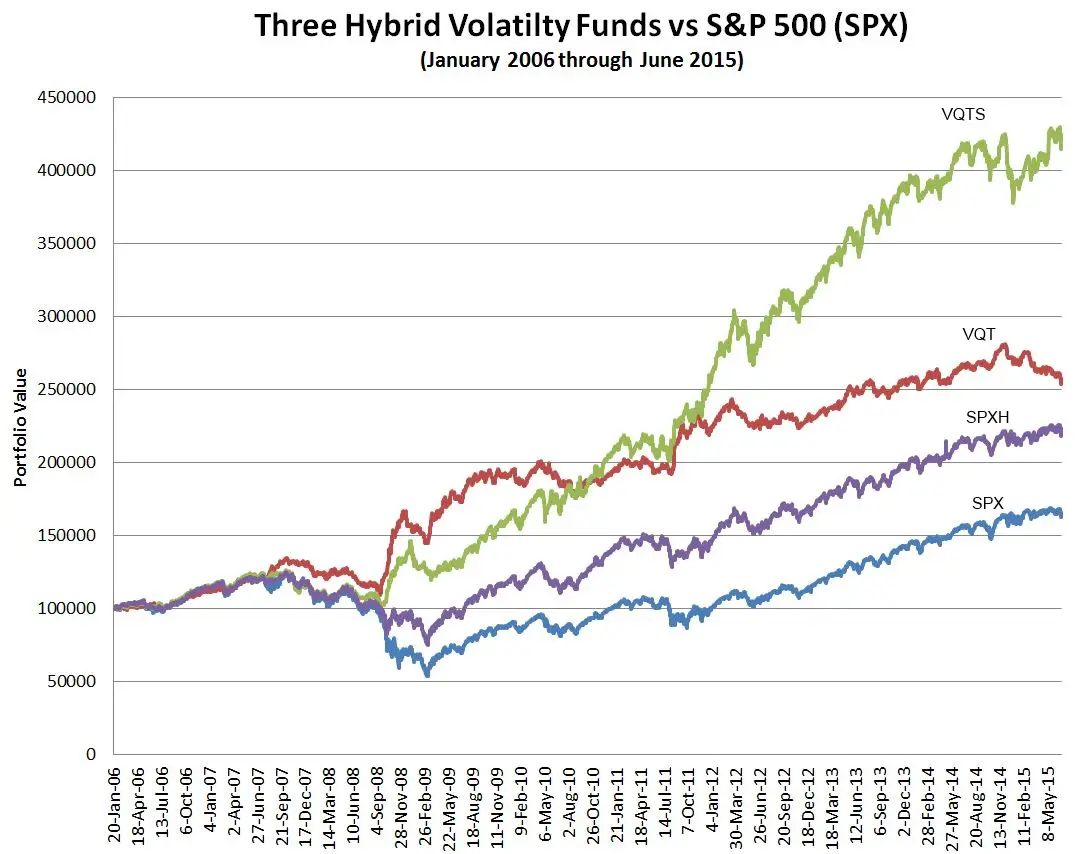
The chart below compares the simulated performance of VQTS compared to SPX, VQT, and SPXH from early 2006.
VQTS defines low volatility as being historical volatility less than 10% using the higher of two exponentially weighted moving averages on volatility. Before shifting allocations VQTS requires that its historical volatility metric move by more than 10% from the target volatility used at its last rebalancing. Once the target volatility climbs above 10% VQTS starts holding cash and volatility securities (2/3rds cash, 1/3rd volatility) in addition to the large cap S&P 500. The table below shows the range of asset allocations as realized volatility increases.
VQTS Asset Allocations
| Realized Volatility (exponentially weighted) |
Equity % | Volatility % | Cash % |
| 0% to 10% | 100% | 0% | 0% |
| 10% to 20% | 100% to 50% | 0% to 16.7% | 0% to 33.3% |
| 20% to 30% | 50% to 33.33% | 16.7% to 22.22% | 33.3% to 44.44% |
| 30% to 40% | 33.33% to 25% | 22.22% to 25% | 44.44% to 50% |
| 40% to 50% | 25% to 20% | 25% to 26.67% | 50% to 53.33% |
| 50% to 60% | 20% to 16.67% | 26.67% to 27.78% | 53.33% to 55.56% |
| 60% to 70% | 16.67% to 14.29% | 27.78% to 28.57% | 55.56% to 57.14% |
| 70% to 80% | 14.29% to 12.5% | 28.57% to 29.17% | 57.14% to 58.33% |
| 80% to 90% | 12.5% to 11.11% | 29.17% to 29.63% | 58.33% to 59.26% |
In October 2008 the realized volatility as computed by VQTS’ algorithms peaked at 82%
When not fully allocated to equities VQTS takes a long or short position in VIX futures depending on the curvature of the futures’ term structure. The term structure is the curve that’s formed if you plot VIX futures’ price vs time to expiration. The decision to go long or short is determined by the comparison between the slope of the two nearest to expiration futures (1st and 2nd) and the slope of the 4th and 7th month futures. I’ve marked up the chart below from vixcentral.com to illustrate the calculation.
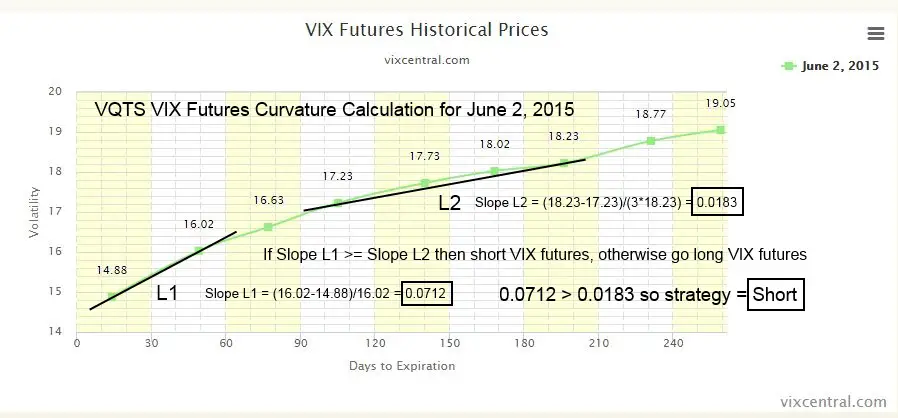
VQTS’ curvature calculation is similar, but not identical to the more familiar designations of contango and backwardation for futures’ term structures. In general VQTS will go long volatility if the term structure is in backwardation (futures prices less than spot), and short volatility if the curve is in contango. This approach would have worked well in the past, profiting from the fast rise of volatility as a crash / big correction develops, and then switching to be short volatility as volatility mean reverts. The chart below shows the simulated performance of VQTS during the 2008/2009 crash.
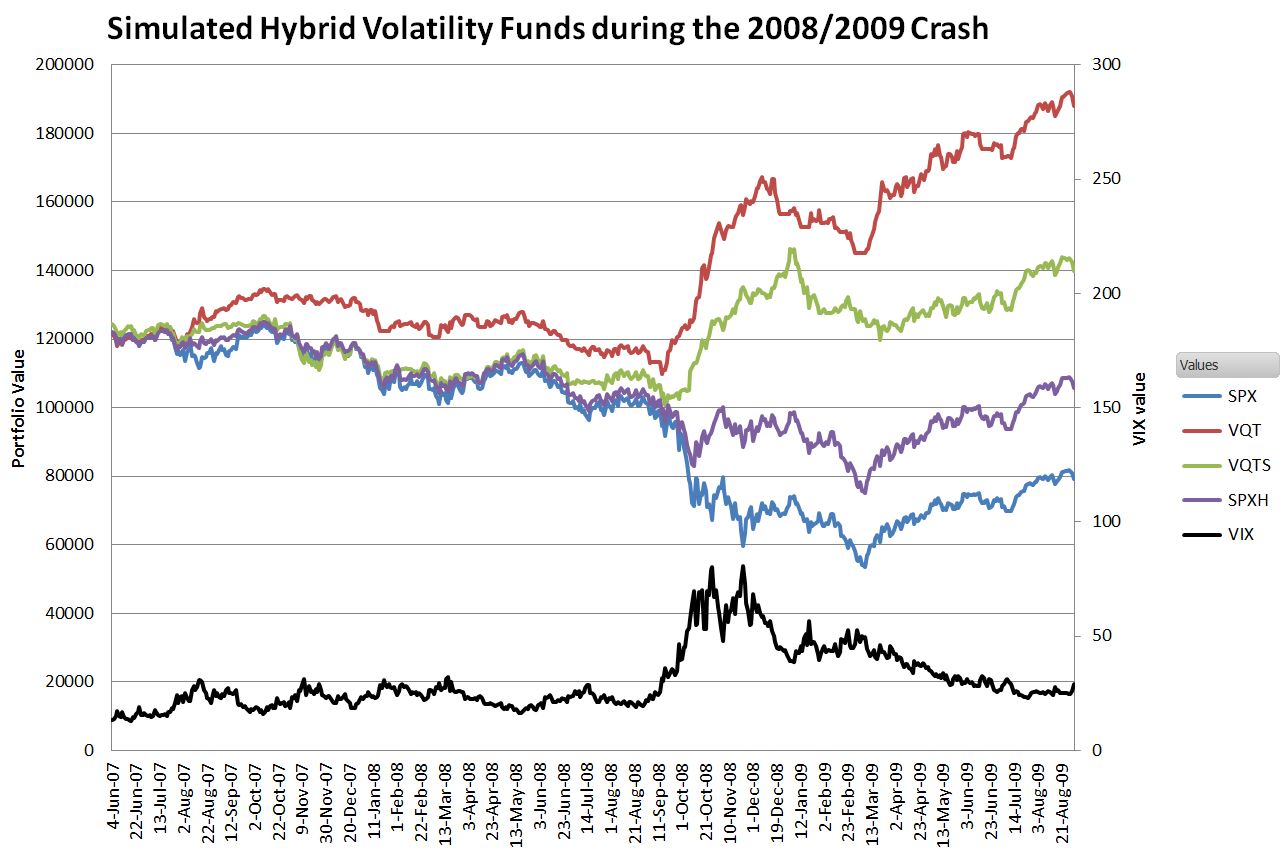
VQTS experienced around a 20% drawdown in the fall of 2008 before rallying to a year end gain of +13%.
Many strategies that backtest well on historical data do not perform well once they go live. As I noted at the beginning of this post VQTS has already shown that it can approximate the S&P 500 during periods of low volatility—the condition the market is in 75% of the time. VQTS’ drawdowns during crashes and corrections are likely to be significant, but VQTS’ strategy of going long volatility during panicky periods and short volatility during the recovery should continue to work well as a way to power through severe downturns. The real challenge for it will be choppy markets with fast declines and V-shaped recoveries.
UBS did think about Black Swan events when constructing this fund. If VQTS was allocated to short volatility when a major disaster (e.g., terrorist attack) occurred the fund could experience very heavy losses. If VQTS is down 60% or more intra-day from the previous close or the indicative value drops below $5 the fund is terminated. This is called an acceleration. The shareholder receives a payout that is equal to the liquidated assets of the fund—which may be higher or lower than the acceleration threshold levels.
VQTS is still a small fund with only $25 million in assets, so investors are hesitant to invest in it, but since the S&P 500 and VIX futures are its underlying securities its liquidity is excellent. Bid/ask spreads have been reasonable—in the 6 to 7 cent range (0.3%).
Everyone knows this bull market will end, the tough part is guessing when. With VQTS you can ride the bull and be prepared for the inevitable bad ending—the primary question being how well it handles the inevitable corrections that happen inbetween.
Can we please let it die ? 0 volume, pathetic performance. Another ETF which looked good on paper but failed miserably after birth. ETF graveyard is littered with it. This should be killed along with VXUP/DN/MN/MX.. etc
Wait didn’t this come out at $25 so isn’t it down like 12% while the S&P500 is flat? I am looking at the Barclays fact card so I could be wrong.
Hi John,
Certainly a risk. It botched the October bounce in the S&P, being long rather than short volatility. Choppy markets are always hard. This fund will do likely do better with strong bull, or strong bear markets.
— Vance
Vance,
Do you think VQTS handled the last few trading days well or would you have expected more outperformance during the recent swoon?
VQTS is not going to dampen 5% or even 10% drawdowns–unfortunately it will just go along for the ride It takes a while before it switches over to be long volatility. Its forte is bull markets when it doesn’t lag the SPX and severe corrections / bear action like 2011 or 2008.
— Vance
Vance, do you suspect that the volatility triggers kicked in on Monday or could later this week (given the heightened VIX since last week)? Or does it need a longer/ sustained period before a switch over? And should we expect choppy volatility (in a sideways to slightly bearish market) to be the achilles heel of this type of strategy?
There is a 3 day waiting period with consistent behaviors before it switches strategies. I thought it would switch today to long volatility, but it didn’t look like it did.
I think you exactly described the riskiest market mode–sideways / slightly bearish.
— Vance
Not impressed with the performance so far. Not as terrible as VXDN VXUP but nevertheless I don’t see it lasting very long.
Don’t know what you’re expecting. VQTS is going sideways, as is the S&P 500. If it holds close to SPX during the good times it is performing as it should.
— Vance
Great write-up. Is there a way to simulate a backtest to see how this one would have theoretically performed going back 15 years or even way back to 1987?
Hi Dph, Unfortunately the VIX futures used have only been trading back to 2004 so that’s the furthest we can go back with a full simulation. The SPX volatility trigger part of VQTS only requires SPX daily close data, so that part of the model could be examined back to the 50s.
— Vance
I imagine VQTS has mostly been in equity since late 2011 but it seems to have risen faster than the SPX over that span?
I assume that is due to the gains from being short VIX during those times. Definitely an interesting product/concept.
Vince: Do you think VQT would do better in a sideways bear? I was wondering about going long VQT and short VQTS during heightened VIX periods and possibly reverse otherwise. This would protect from big shocks, but take advantage of longer term trends–possibly [?]