Update: On October 6th, 2014 the CBOE changed the calculation method for the VIX to include SPX weekly options, the old VIX calculation is still being reported using the VIXMO (VIX Month Only) ticker. The new calculation uses the VIX ticker. For more on the new calculation see “Calculating the New VIX“.
The movements of the CBOE’s VIX® are often confusing. It usually moves the opposite direction of the S&P 500 but not always. On Fridays the VIX tends to sag and on Mondays it often climbs because S&P 500 (SPX) option traders are adjusting prices to mitigate value distortions caused by the weekend.
In addition to these market driven eccentricities the actual calculation of the VIXMO has some quirks too. The VIXMO is calculated using SPX options that have a “use by” date. Every month, on the morning of the 3rd Friday, the current month’s options expire. This schedule of expirations forces the VIXMO calculation to periodically switch to longer dated options.
The VIX provides a 30-day expectation of volatility, but the volatility estimate from SPX options changes in duration every day. For example, on May 1, 2013 the May SPX options, expiring on the 17th, provide a 16-day estimate of volatility, while the June options, expiring June 21st provide a 51-day estimate. To get a 30-day expectation the VIXMO calculation uses a weighted average of the volatility estimates from two months—in this case May and June options.
The full blown S&P 500 VIX calculation is documented in this white paper. It computes a composite volatility of each month’s options by combining the prices of a large number (> 100) puts and calls. Before the advent of the new VIX calculation the CBOE published the result of these intermediate calculations as VIN for the nearer month of SPX options (not necessarily the nearest), and VIF for the further away options at one-minute intervals. Now the CBOE has repurposed those tickers for the new VIX calculation so the monthly values of VIN and VIF are no longer published. All the references in the rest of this post refer to the old VIN and VIF values.
Using the old VIN and VIF values in a 30 day weighted average calculation the final VIX value is determined. Graphically this calculation looks like the chart below most of the time:
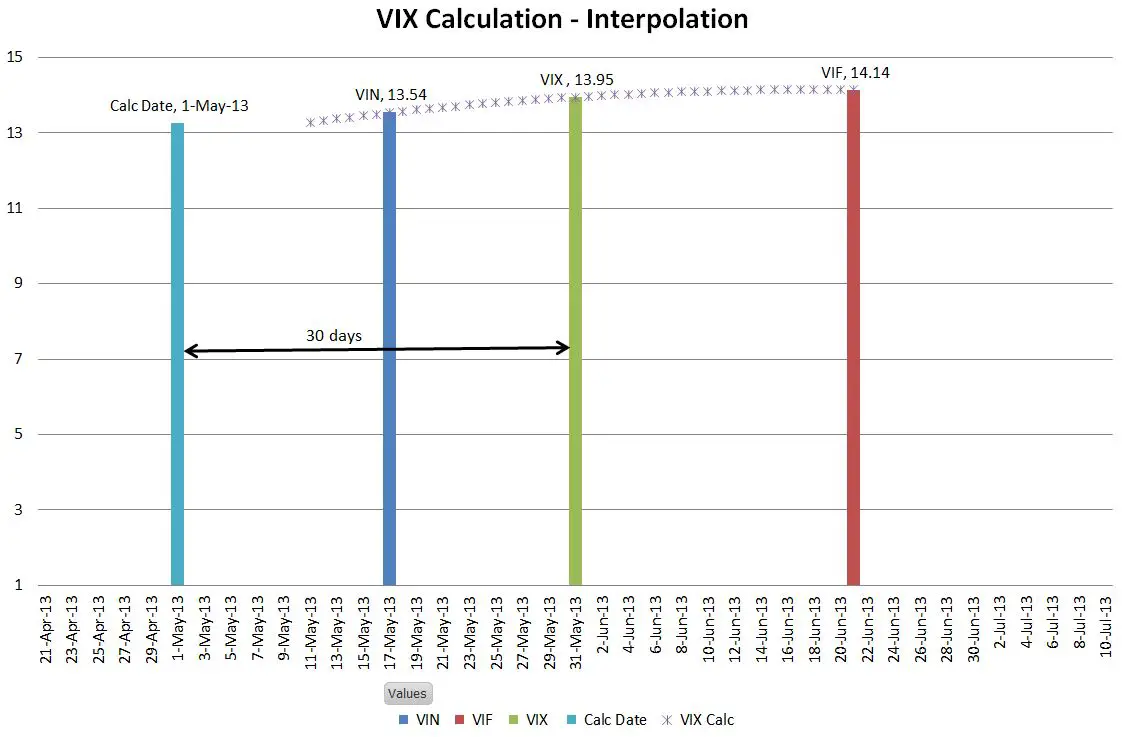
In this example the VIXMO value for May 1st is computed by averaging between the May SPX options (VIN) and the June SPX options (VIF) to give the projected 30 day value. Clearly the averaging algorithm used by the CBOE is not just a linear extrapolation between VIN and VIF; I provide details on this calculation later in the post.
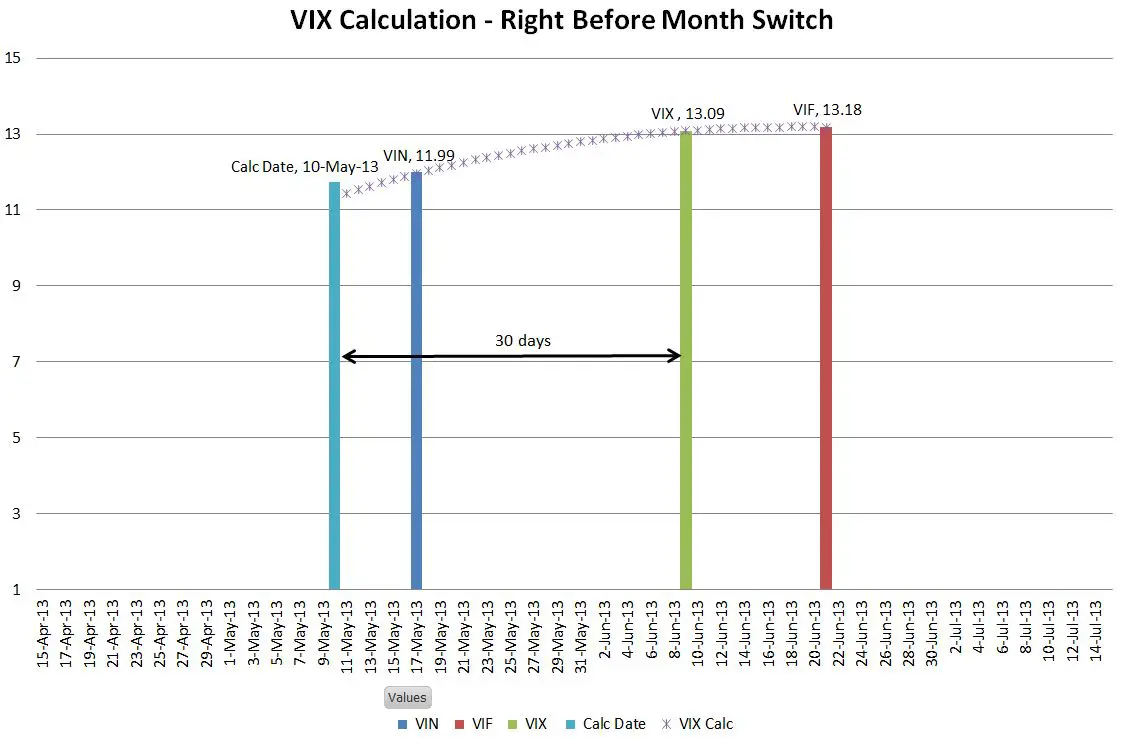
Options can be flaky in their last week, so when the VIN options are less than 7 days from their expiration the algorithm switches to the next pair of months. The next chart shows the calculation right before the switch.
The chart below shows the calculation on the next trading day when VIN switches to June options and VIF uses July options. Notice how the green VIXMO bar is now to the left of the blue VIN bar.
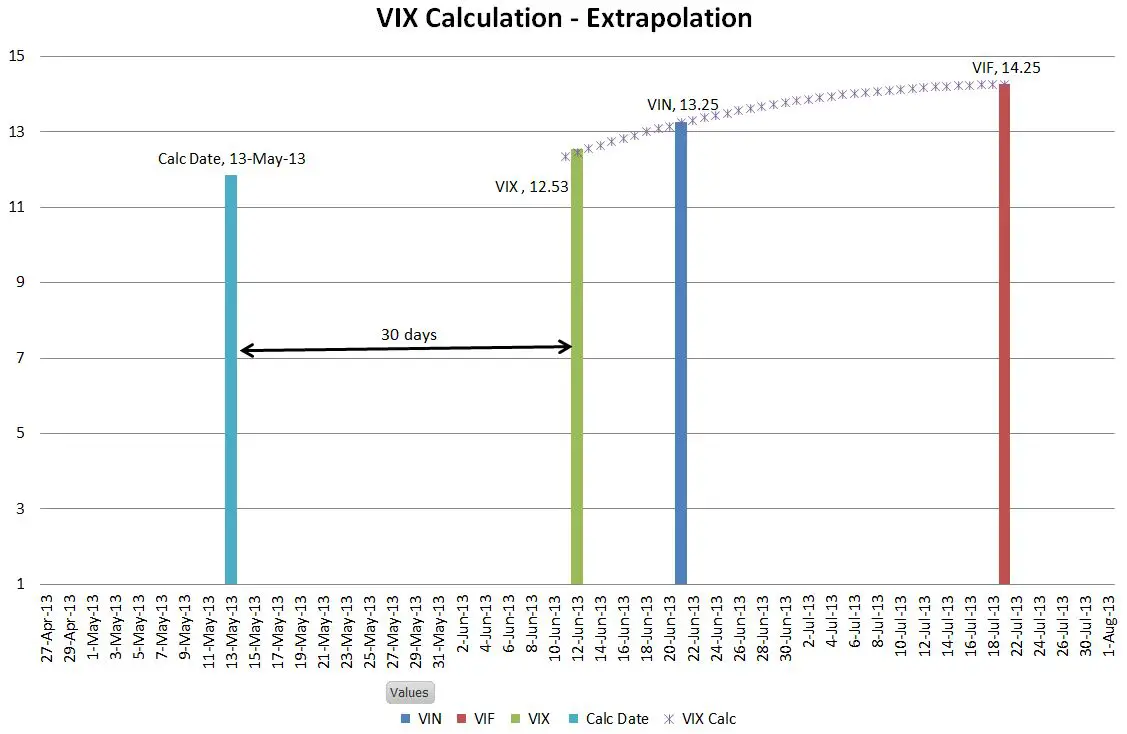
The VIXMO calculation is now outside the VIN / VIF values—an extrapolation. If the term structure of the June / July options is significantly different than the May/June offering the resultant VIX value can jump significantly during this switch. While the VIXMO calculation is in this extrapolation mode I suspect that the VIXMO’s weekend effects are stronger because any change in the VIN options will whip the VIXMO value around.
The chart below shows the special case situation of the VIXMO’s monthly expiration:
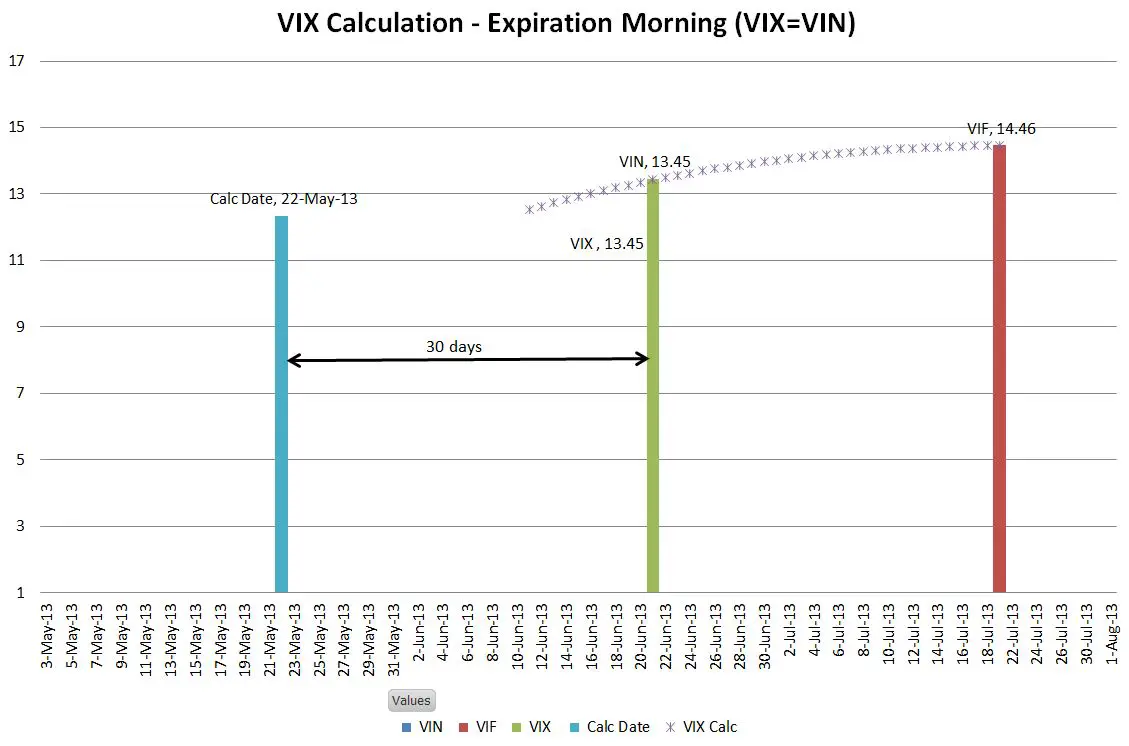
On the Wednesday morning of VIX expiration the VIN SPX options are exactly 30 days from their expiration. The result is that VIX = VIN and the special opening quotation SOQ and resultant final settlement value VRO only concern VIN options (June SPX in this example). It doesn’t matter if an earlier monthly series of SPX options hasn’t expired yet—they’re not included in the VIX calculation. In this situation the VIXMO and VIX calculations are guaranteed to give the same result.
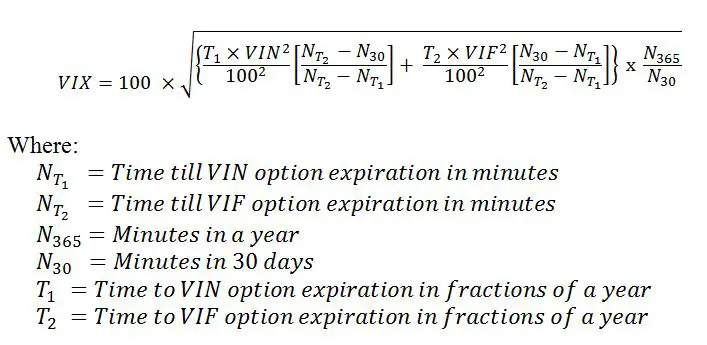
If you want to compute the VIX yourself using the VIN and VIF values you can’t just do a linear interpolation / extrapolation because volatility does not vary linearly with time. Instead you have to convert the volatility into variance, which does scale linearly with time, do the averaging, and then convert back to volatility. The equation below accomplishes this process.
The SPX options used for VIX calculations expire the 3rd Friday morning of the month at 9:30ET. See Trading SPX/SPXPM options for more information.
Thank you for this article!
You mentioned: “On Fridays the VIX tends to sag and on Mondays it often climbs because S&P 500 (SPX) option traders are adjusting prices to avoid paying for time decay over the weekend.”
I made a simple custom index in Excel based on VIX (though it is not investable) that rebalances according to the following rules:
1) if it is Friday, weight of Vix = 100% on close,
2) if it is Thursday or Monday, weight of Vix = -100% on close.
That index appears to be growing enormously over the long-term (20+ yrs). I know, Vix is not investable, but is it possible to apply this over XIV and VXX somehow?
I tried this using historic prices of XIV and VXX from Y!Finance, but that was not that good over the timeframe available from yahoo. Plus, contango / backwardation seem to impact somehow.
Hi Dias,
Unfortunately this effect is not seen on the VIX futures, so none of the volatility ETPs like XIV/ VXX have this behaviour.
— Vance
I learned a lot by your informative blog. Thanks for your effort. The markings of 30 days range in the first and third pictures seem to be mistaken, though.
BTW
May I ask for the simulated data of VXV since Mar, 2004 ? I couldn’t find any analysis concerning VXV prior to Nov, 2007 except your blog.
Hi Joe,
Thanks for pointing out the error. I’ll fix it in the next couple of days.
Best Regards, Vance
You couldn’t have explained and demonstrate these key facts better or more clearly. Kudus.
Thanks!