Current Status and Recent Moves
- Current Status: Frank’s method moved to 100% long SPHB 11-April-2025
- 50% short from 28-Feb-2025 to 11-April-2025
- 100% long from 13-Sept-2024 to 28-Feb-2025
Introduction
In 2013, I wrote The Modified Ned Davis Method, an article posted on Six Figure Investing, which described a greater than 50-year out-of-sample test using primarily the Russell 2000 index. The test continued until recently, posting trade updates on Six Figure Investing and X within a few days after each trade was made. Even though results were computed only using price movements, not counting dividends or interest income on cash, the method significantly outperformed a buy and hold strategy with both the Russell 2000 and the S&P 500 index.
This method began from the 4% Rule designed by Ned Davis and described in Marty Zweig’s Winning On Wall Street, first published around 1986. Davis’s method used only weekly closes of the Value Line Geometric Index. A buy signal was given by any 4% or greater gain, and a sell and short signal was given by any 4% or greater decline. The Value Line, and later Russell 2000, had betas of about 1.2. Compared to the S&P 500, they would typically rise by a greater percentage in a bull market, and decline by a greater percentage in a bear market. I wanted to create a method that would profit in both bull and bear markets, so these were good candidates.
The Modified Model
But the 4% Rule needed improvements. It tended to sell and go short too soon, and most shorts ended with a loss. I improved things by:
- Constructing a rising trend line from the low before the beginning of a buy signal. Price would need to drop below both the sell threshold and the trend line to signal a sell.
- Enabling a short only when the daily NYSE breadth advance-decline line was making a bearish divergence from S&P 500 price.
The latter is an idea I got from Stan Weinstein’s Secrets For Profiting in Bull and Bear Markets, first published around 1983. At a sell, if there was no divergence, the method would sell only 50%, returning to 100% long at the next buy signal. If there was divergence, the method would exit 100% and sell short, but only at the 50% level. (Bear markets are too volatile for my taste.)
I also tried buy & sell thresholds other than 4% and discovered that 4% usually was not the most optimal value. Finally, I allowed the buy and sell thresholds to be different from each other.
My method thus was controlled by 3 parameters: buy threshold, sell threshold, and trend line slope. I then realized that I could run a forward, or out-of-sample, test using a composite index that began with Value Line at its inception, and switched to Russell 2000 when it began in 1979. It would work as follows: It would make the first trade using the “default” values of 4% for both thresholds and 45% for the trend line slope. When that trade ended, that result would be recorded. Then a back test would be run from the index starting date to the end of that trade, using all possible (and reasonable) values of the 3 parameters, selecting the triple that performed the best. Then the next trade going forward would be made using that triple, and that result recorded. This procedure was repeated for all available data.
The method did fairly well through the 2022 bear market, but began to degrade in 2023 as small caps began to go out of favor. About this time I happened to learn of the SPHB ETF, which is based on the S&P 500 High Beta Index. Its beta is about 1.5. I tried my method on this ETF via a back test beginning in 2012, using my original program that selects the parameter values that provided the best performance through 2022. Results were encouraging, but I was reluctant to publish anything because there was not enough data available to make an extensive out-of-sample test. All I had was an 11-year optimized back test.
But I kept rerunning the back test as more data became available, and the same parameter values were always chosen. I was fully invested in a number of ETFs, including SPHB, when the market began to decline early in 2025. The SPHB method gave a 100% sell signal on Feb. 28, so I sold just about all of my holdings at that point, deciding to purchase mostly SPHB at its next buy signal, which came on April 11. The method is still using the same parameter values that it selected more than 2 years ago. SPHB has gained nearly 40% since the April 11, 2025 buy. Unless stated otherwise, my positions will match the current status indicated at the beginning of the post.
The chart below shows the weekly results of this method, plus buy and hold of both SPHB and SPX, from 2012 on. The 2012 through 2022 results are an optimized back test, so take that for what it may be worth, but the results since 2023 are out-of-sample, using the parameters that the back test selected at the end of 2022.
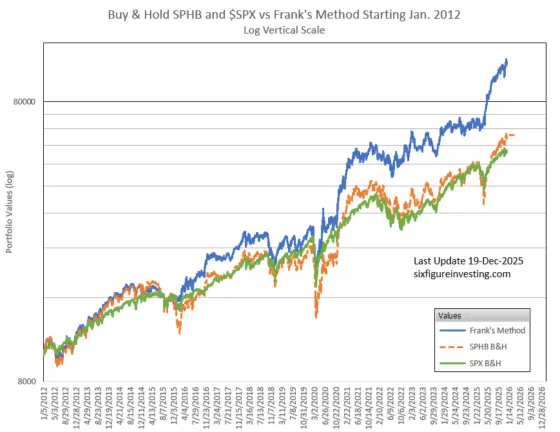
Since the holdings of the S&P 500 High Beta Index are adjusted over time to include only those with the highest beta, I believe that this method is likely to continue to do well, not being dependent on the continuing superior performance of any one index or sector. As I did with the original Value-Line/Russell 2000 method, I will post all future trades of this method here as soon as possible after they occur.
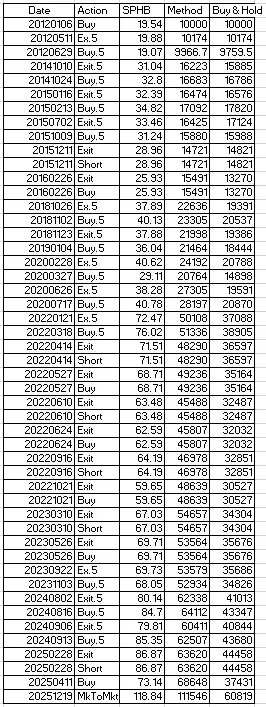
The full sequences of moves is shown below:
this is intruiging. Thank you very much, Vance. I know of no other strategy that so successfully invests in SPHB.
Am I right in assuming this is the place to see new signals when they occur, and not your X account?
Best, Martin
Hi Martin, Yes, Frank will update me when the allocations change. — Vance