Update
UBS decided to shutdown their EVIX & EXIV long / inverse volatility funds that are based on the European VSTOXX volatility futures effective April 9, 2020 I suspect this occurred because they never gathered enough assets to be profitable.
In May 2017 VelocityShares introduced two volatility funds, EXIV and EVIX, which track European volatility futures. In digging into these funds I’ve encountered a dense mashup of the familiar and the foreign. The differences between European Volatility futures and VIX futures are relatively small so it’s reasonable to view EXIV and EVIX as close cousins of ProShares SVXY and Barclays’ VXX, however, these funds depend on a set of securities and processes with subtle and not so subtle differences with the mainstay USA volatility funds.
If you are not familiar with VIX futures based volatility Exchange Traded Products (ETPs) then I recommend you first take the time to read these posts on ProShares’ SVXY and Barclays’ VXX before you tackle these altnernatives. One thing to remember is that after the February 5, 2018 “Vol Tsunami” SVXY’s leverage factor was lowered by Proshares from -1.0X to -0.5X of its reference index. EXIV’s leverage factor remains at -1.0X.
Some Basics
- EVIX is a short-term long volatility fund that will tend to go up if European stocks go down significantly.
- EXIV is a short-term inverse volatility fund that tracks the opposite of EVIX’s percentage moves on a day only basis. Because EXIV adjusts its assets at market close to achieve its daily tracking goal it does not behave like a true short of EVIX—which can be a good thing or a bad thing depending on the market moves.
- The Swiss bank, UBS AG, is the issuer of both of these Exchange Traded Notes (ETNs). They are structured as unsecured long-term debt securities. As of December 2018, Moody’s rating of UBS’ long-term debt was: “Aa3 Not on Watch” The investor fee charged by UBS AG is 1.35% annualized for EVIX and EXIV, this compares to 0.95% for SVXY and 0.89% for VXX.
- The European Volatility futures that these funds track settle at expiration to the European volatility index VSTOXX. VSTOXX uses a methodology very similar to the CBOE’s VIX but instead of being based on the prices of S&P 500 (SPX) options the VSTOXX is based on STOXX option prices.
- The STOXX index is comprised of 50 of the largest companies in the Eurozone and is capitalization-weighted like the S&P 500. It does not include companies from the UK. These 50 stocks represent around 60% of the Eurozone stock market value. In comparison, S&P 500 represents around 80% of the total USA stock market capitalization. Similar to the S&P 500 index, the STOXX index does not include dividends, so the returns of actually holding the constituent stocks would be higher than the index indicates. For the last 5 years, the STOXX dividends have averaged 2.5% vs 1.9% for the S&P 500.
- EVIX and EXIV track indexes (VST1MSL & VST1MISL respectively) that theoretically hold a mixture of the two VSTOXX futures nearest to expiration. The mixture gives an expiration horizon of 30 days, similar to the VIX future based short term volatility funds like VXX and SVXY. These funds are fully divested out of expiring futures the day before their expiration/final settlement.
- Both funds effectively do a daily end-of-day rebalance that adjusts the number of volatility contracts that they hold in order to maintain a 30-day average horizon. At the same time EXIV also does an asset rebalance such that its daily percentage move will closely match the opposite of EVIX’s next day daily percentage move (see How Does SVXY Work? for more on this).
- Standard processes and rough equivalences in key securities
| Generic Securities
Categories |
European Version | USA Version | Standard Processes |
| Volatility Futures | VSTOXX futures | VIX futures | Settlement |
| 30-day Volatility Index | VSTOXX | VIX | Index calculation |
| Large Cap Stock Index | STOXX 50 | S&P 500 | Stock index selection |
| Large Cap Stock Options | OESX | SPX | Settlement, Cash Settled, European exercise |
-
- The key European securities and processes are similar to the USA markets but in no case have I found a pair of processes that are identical. For example, VIX futures settle to a special opening quotation of the CBOE’s VIX® soon after market open on expiration days whereas VSTOXX futures final settlement price is determined by the average VSTOXX index level between 11:30 and 12:00 CET on the day of expiration.
- A significant difference between the VIX and the VSTOXX index is that the VSTOXX calculation does not incorporate options with bid prices below 50 Euro. This contrasts with the VIX’s calculation which uses options with bids as low as $5—which increases the chances that an institutional player might attempt to influence the VIX’s settlement value in their favor by buying or selling cheap out-of-the-money puts.
- Quotes / Historical Data
- While free quotes for EXIV and EVIX are easy to get with the usual sources (Online brokers, Yahoo, Google), obtaining quotes for the underlying securities/indexes is tougher. The ones I’ve found so far are:
- STOXX
- Quotes Yahoo Finance (ticker ^STOXX50E)
- Historical Data: Investing.com
- VSTOXX (ticker V2TX or DVY00)
- Quotes and historical data Investing.com
- Quotes of spot and futures Barcharts.com
- Historical data for many VSTOXX indexes (2009-2016) STOXX.com
- Quotes and historical data (1999-present) STOXX.com
- VSTOXX 3Month, Similar to VIX3M (ticker V6I3)
- Quotes and historical data (1999-present) STOXX.com
- VSTOXX Futures
- Quotes of spot price and futures Barcharts.com
- Euroexchange.com
- VST1MSL (EVIX’s index)
- VST1MISL (EXIV’s index)
- Intraday Indicative value (IV) quotes for EXIV and EVIX are available from some brokers and Yahoo Finance. The symbols within Yahoo are ^EXIV-IV and ^EVIX-IV
- Hours
- Typically the European continent is 6 hours ahead of USA Eastern time. Standard closing time on the European continent exchanges is 5:30 PM, so they are closing at 11:30 Eastern time. The IV values for EXIV and EVIX don’t update after 11:30 ET because the OESX options used to compute VSTOXX are not trading past then. The Yahoo finance chart below illustrates EXIV’s IV value flat-lining during the afternoon.
- The VSTOXX futures referenced by these funds trade from 7:30 to 22:30 CET.
- Typically the European continent is 6 hours ahead of USA Eastern time. Standard closing time on the European continent exchanges is 5:30 PM, so they are closing at 11:30 Eastern time. The IV values for EXIV and EVIX don’t update after 11:30 ET because the OESX options used to compute VSTOXX are not trading past then. The Yahoo finance chart below illustrates EXIV’s IV value flat-lining during the afternoon.
- Termination risk
- EXIV will terminate if there is a large enough volatility spike. Once thought by some to be unlikely the termination of XIV in February 2018 demonstrated that this can happen. The funds are guaranteed to not go below zero and the issuers will not commit extra capital to meet margin calls in that sort of extreme situation. In EXIV’s case, the fund will be automatically terminated if the drop in the intraday IV value is 75% or more from the previous day’s close. For the USA markets, historical data suggests it would take a VIX intraday spike of at least 80% to result in a 75% drawdown in the inverse volatility funds and I suspect that the VSTOXX/ VSTOXX futures sensitivities are similar. In the case of termination, shareholders would receive a final share value reflecting the net value of the fund a few days after the triggering event. The value is not guaranteed to be 25% of the previous day’s value, it is only guaranteed to be zero or higher.
Comparing Markets—and Indexes
The chart below compares the historical values of the S&P 500 and the STOXX as well as the VIX and VSTOXX since January 1998.
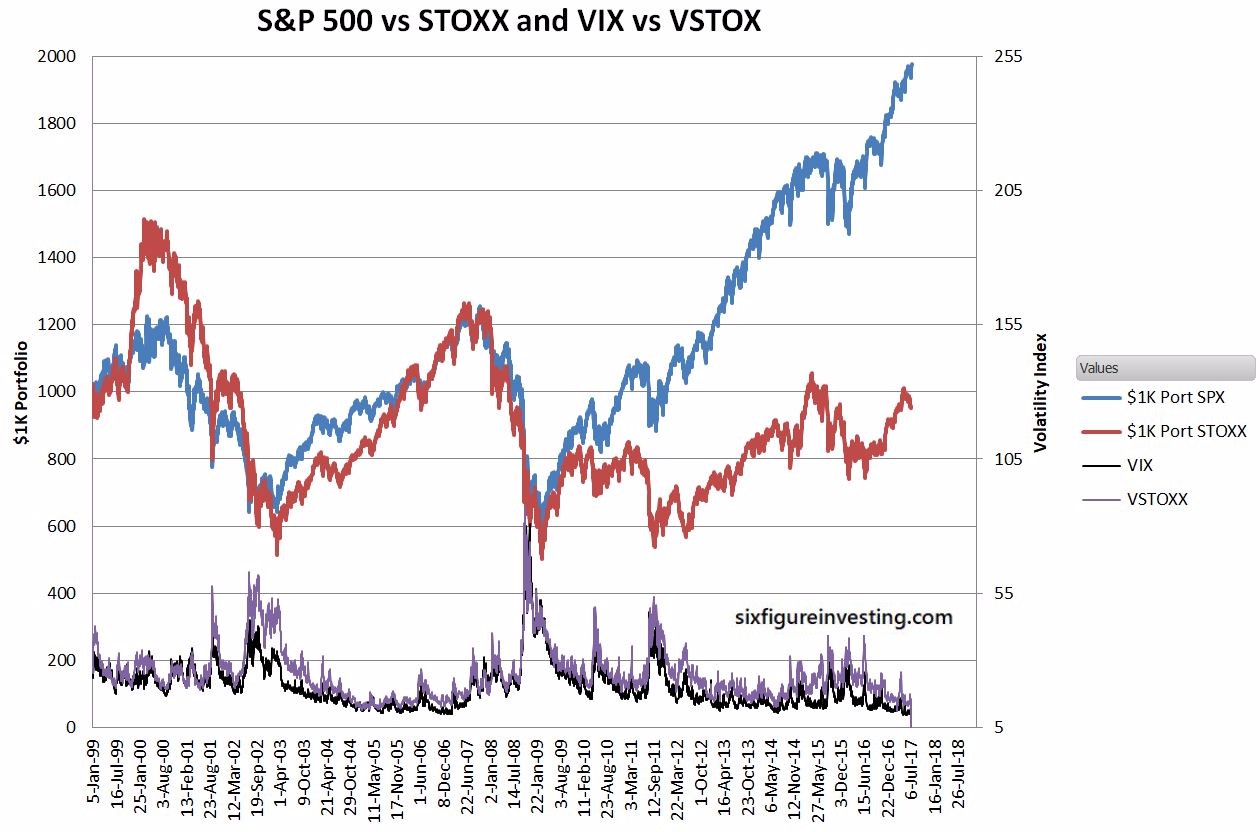
- A few things stand out when looking at the STOXX (red line)
- The STOXX fully participated in the 2000 dot-com crash and the 2008/2009 bear markets
- The STOXX is still well below its 2000 highs—the lack of recovery in the STOXX after the 2008/2009 financial crash is striking
- Looking at VSTOXX (purple) vs the VIX (black) above:
- The VSTOXX shows mean-reverting behavior similar to the VIX. Sharp spikes up are followed by fairly rapid decays towards the mean values.
- Periods of low volatility can persist for a long time but eventually, the VSTOXX reverts back to values closer to the mean
- Generally, the VIX and the VSTOXX are closely correlated
- The VSTOXX value is almost always higher than the VIX’s value
- Some statistics for the S&P 500 and the STOXX, January 1999 through July 2017:
| S&P 500 | STOXX | |
| Compound Annual Growth (dividends not included) | 3.75% | -0.25% |
| Annualized Volatility (365 day year) | 23.4% | 28.1% (20% higher than S&P 500) |
| Worst Case Drawdown | -56% (2009) | -65% (2003) |
| Correlation of % moves | 0.54 (moderately high) between S&P 500 and STOXX |
- Statistics for the VIX and the VSTOXX, January 1999 through May 2018
| VIX | VSTOXX | VSTOXX compared to VIX | |
| Average | 20.05 | 24.40 | 22% higher |
| Median | 18.2 | 22.54 | 23% higher |
| Low | 9.14 | 10.68 | 14.5% higher |
| High | 80.86 | 87.51 | 8% higher |
| Annualized Volatility
(365 Day Year) |
129.3 | 114.42 | 13% lower |
| Value Correlation | .905 (high) between VIX and VSTOXX values | ||
| Correlation of % moves | 0.544 (moderately high) between VIX and VSTOXX % moves | ||
| Biggest one day drop | -29.5% (10-May-10) Flash Crash aftermath | -35.2% (24-Apr-17) Le Pen defeat | |
| Biggest one day spike | +115.5% (5-Feb-18) “Vol Tsunami” | +38.8% (24-Aug-15) China scare II | |
| Mode (most common value) [0.1 pt bins] | 13.3 | 23.1 |
The chart below shows a histogram of values for the VSTOXX and the VIX
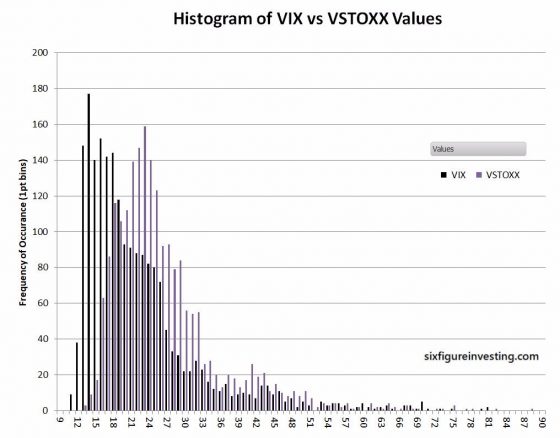
- A few observations:
- The VSTOX distribution is shifted notably higher in value than the VIX
- While the two index distributions have truncated left “shoulders” and big fat tails on the right the VSTOXX has a significantly more balanced distribution around its mean compared to the bottom-heavy VIX.
- The difference between the mode (the most common value rounded to 0.1 pts) and the record low is only 45% with the VIX compared to 116% for the VSTOXX
Historic Performance
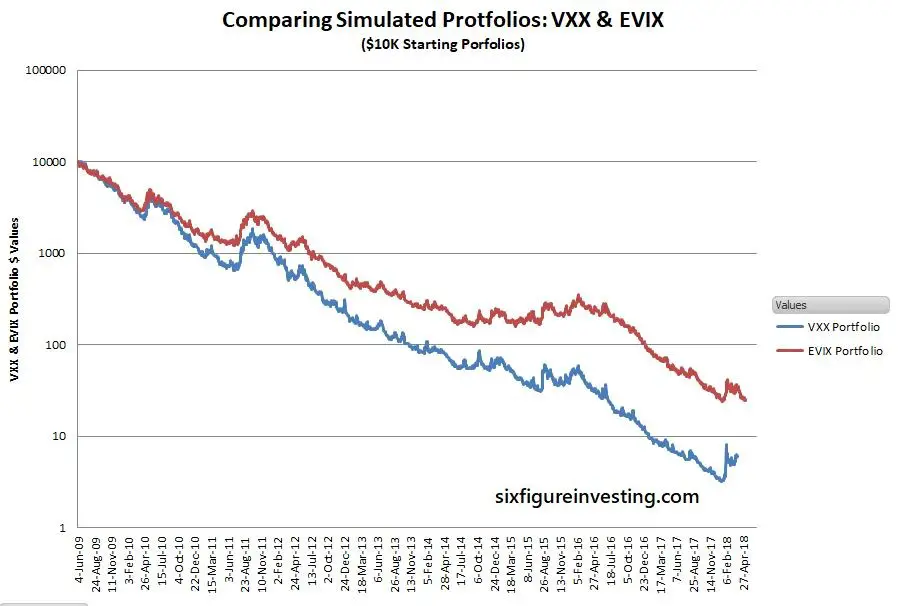
- By using a simulation starting in June 2009 of EXIV and EVIX we can get a feel for their performance relative to SVXY and VXX. The chart below shows relative performance when starting with portfolios of $10K fully invested in each of the funds.
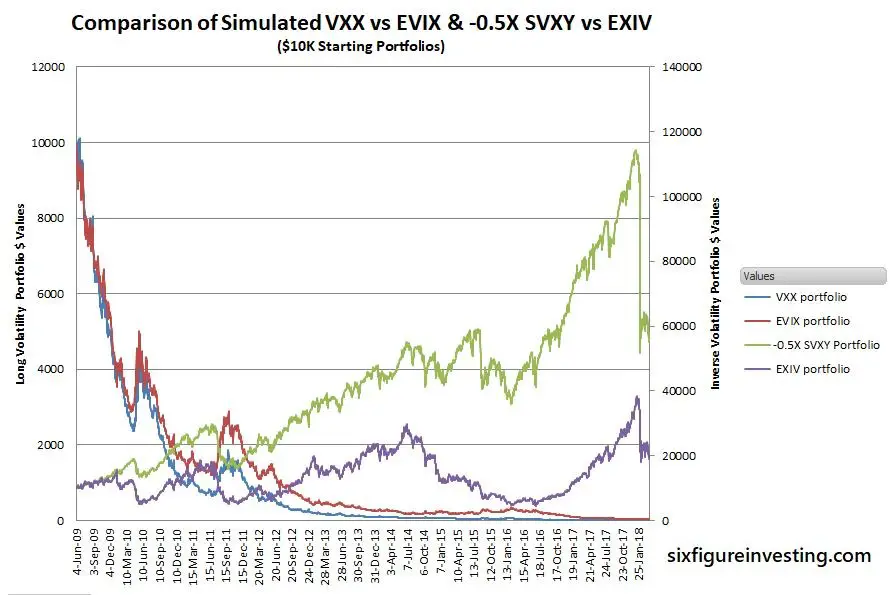
- The two lines starting high on the left (red and blue lines) are long volatility funds that reference the left axis scale. The long volatility funds exhibit the typical long volatility fund race to zero, with VXX slightly better at losing value.
- The two inverse volatility funds (green and purple lines) referencing the right scale perform much better than the long funds. Overall the -0.5X SVXY’s performance is better with an approximate 12X growth since 2009. Both funds lost approximately 50% of their value in the February 5th, 2018 volatility spike.
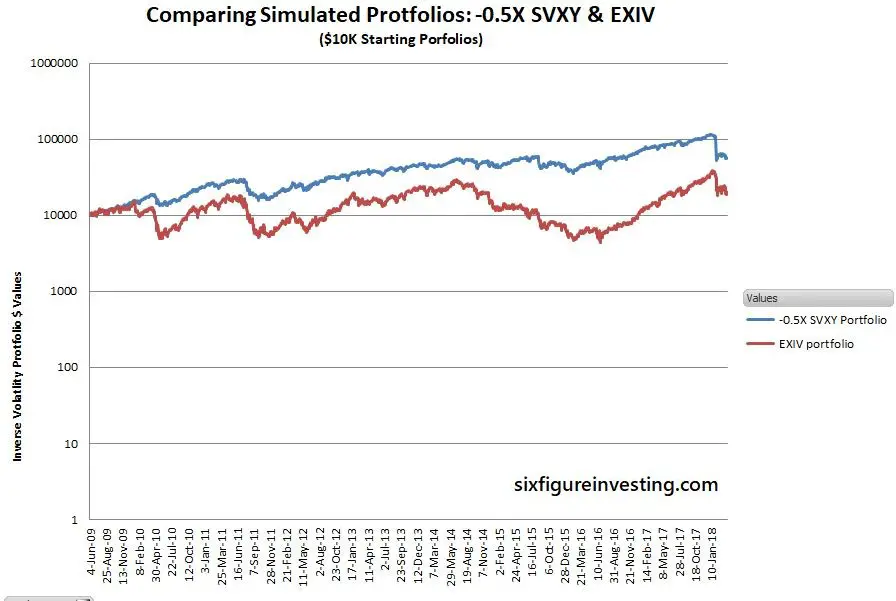
Using a log scale on the vertical axis provides a more accurate visual way to judge relative performance. The first chart shows VXX index vs the EVIX index
- The two portfolios begin diverging in early 2010 and don’t return to a similar loss rate until 2016.
- Over the 2010 to 2015 period EVIX’s decay rate was significantly lower than VXX’s. It’s likely that the VSTOXX futures had considerably lower contango levels during that period compared to the VIX’s futures
- Looking at the inverse volatility side of things EXIV lagged SVXY until around 2015. At that point, the improvements in the European markets fueled a strong period of contango driven growth in EXIV.
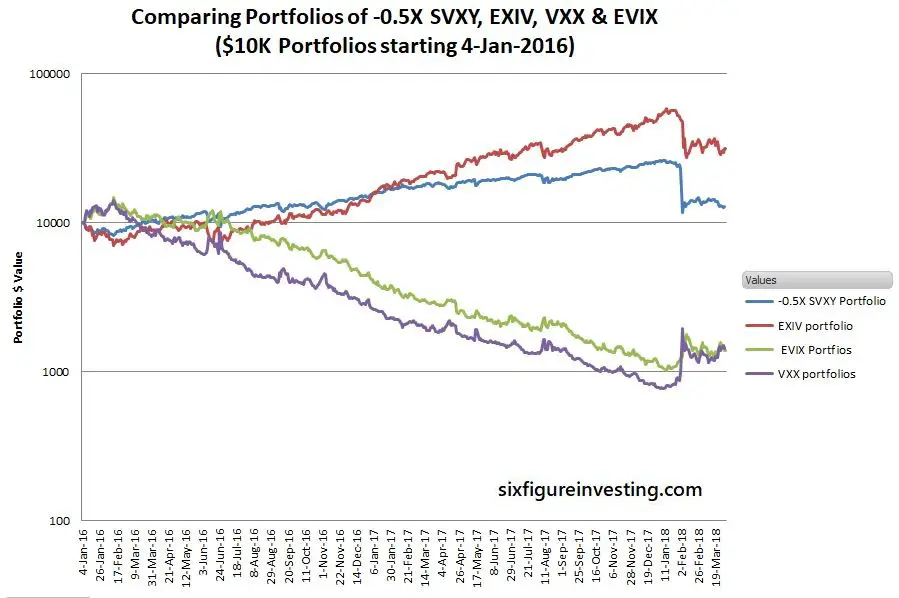
The chart below, starting in January 2016 more clearly shows how EXIV has outperformed the -0.5X SVXY in the last couple of years. The non-leveraged long USA and European based funds have tracked each other relatively closely over that same period. The chart below shows the result of the simulation.
When to Use These New Funds
- An obvious application for these new funds is placing a bet on an upcoming European event with potentially major impact (e.g., a Brexit vote, or French election). In “known/unknown” cases like this the date of the event is well-known, but the result is uncertain and potentially economically impactful. It’s certain that the VSTOXX will go up before an event like this, the interesting, and potentially lucrative question is what will happen to volatility after the event—panic/distress or collapse back to the status quo.
- Diversification is another application. Obviously, the European markets are not in lockstep with the USA markets and this distance will tend to smooth out some of the volatility shocks.
- Having EVIX and EXIV gives traders a way to profit if they see an upcoming convergence or divergence between the volatility indexes in the two markets. For example, if you believe a recent volatility jump in USA markets will propagate to Europe you could do a straight EVIX purchase or a pairs trade between EVIX and a long volatility fund like VXX.
- It might be possible to do some form of contango arbitrage with these funds. It’s certain that the contango losses/gain won’t be identical between the two sets of futures markets, a pairs trade might allow a trader to profit from the difference in contango rates with overall reduced risk exposure.
Oddities
- There are differences in the trading hours of these two markets. On the USA side of things, the Intraday Indicative (IV) quotes will be frozen on EVIX and EXIV past the normal close of the European markets, depriving us of an important piece of trading information that’s useful for trading low volume ETPs like these. On the European side, we have times when the volatility securities are trading while the USA markets are closed. For example, you might want to close out EXIV positions if the STOXX was crashing, but if the USA markets are closed there would be no direct way to do that.
- Since VSTOXX futures are denominated in Euros and EVIX/EXIV are dollar-denominated, exchange rate changes will have effects, although compared to the normal hysteria of volatility markets I doubt it will be significant. Since EXIV is effectively short VSTOXX futures the impact of currency rate changes will be in the opposite direction of EVIX which holds long positions.
- The EVIX/EXIV calculations assume that cash not needed for margin on the futures will be “invested” in short term German treasury bills—which have been running at negative interest rates (May 2018 -0.33%). Negative rates will result in a minor drag on these fund’s values.
- Options are available on EVIX, but not on EXIV. You might guess that the CBOE shies away from options on inverse volatility funds because of their termination risk, but options are offered on ProShares’ SVXY so this argument doesn’t hold up. My understanding is that the SEC has a blanket prohibition on options for leveraged (-1X or 2X on up) Exchange Traded Notes (ETNs). This seems a bit arbitrary, the big banks that issue the ETNs typically have investment grade credit ratings, but ETFs do have the advantage of transparency into what assets the issuer is actually holding.
Conclusion
It’s head spinning to introduce a whole new set of securities and indexes into the already confusing area of volatility investing but as I reviewed the different ways to use EVIX and EXIV it appears well worth the trouble to learn a few new things. These funds open up new volatility based opportunities in geographic-based investing, diversification, and arbitrage style trades.
Vance,
UBS did the unthinkable for this ETN and just exercised its optional call. EXIV never hit its stop loss termination, even when VSTOXX had spiked to a point where it was trading at $5 per share. UBS / VelocityShares actually doubled its issue of EXIV a few weeks ago (presumably because it was getting very popular among people who thought the VSTOXX would revert to the mean), took the daily fees from the buyers and then UBS hit its optional redemption call, essentially right when the CARES Act is expected to pass and VSTOXX would presumably start bounding up a bit into $10 dollar territory and some folks might ask for redemptions (50,000 shares min.). Basically, this is much worse than what CS pulled when its iteration of this junk cratered (at least in that iteration, they had a real margin call from what I understand). Instead, UBS has basically thrown its hands up and said, “thanks for the fees, thanks for being in the middle of this trade but we’re done and going home”. Absolutely brutal – I do not think UBS or Velocity Shares will ever have credibility for this type of product ever again.
Hi David,
My take is that this was simple economics. There are significant ongoing expenses with funds like these and with their combined assets in the $65M range, it is unlikely these funds were profitable for UBS. I’m sorry to see them go, it was good to have exposure to the European markets but they never really caught the market’s attention. — Vance
I’m incredibly glad i’m reading this! I assumed I had found a home run in this madness for the next year (smh)
I see they say the settlement date will be April 9th, will the value of the EXIV continue to price normally or will it tank in value as settlement approaches??
It should continue to price normally.
— Vance
Got it, thanks! And final question as i try to find an exit to this now very bad position… why has the EXIV gone down so much over the past week when the VSTOXX itself has gone from 64 to 49? I assumed this inverse position should have gone up significantly during such a decrease on the VSTOXX.. or am i missing something?
Thanks Vince – My guess is that in light of the extended VSTOXX volatility, their cost of rolling the contracts everyday and the prospect of having to pay people out in a redemption scenario really screwed them up. One feature of this that many in the market never caught on was that if you held 50,000 shares, you could force UBS to redeem at the Closing Indicative Value so I am going to guess that UBS was sh*tting their pants over folks who bought in at the 5 dollar per share low coming to them with redemption tickets when VSTOXX reverted to mean and this goes back to trading at 35 -45 dollar range. Instead of paying, they popped the nuclear button. I for one, will never buy anything like this from UBS or CS ever again. I’m also going to guess that majority of people who bought this was HNWs and small hedgies so UBS did not care about burning bridges with them.
Hi David,
These funds always hedge their positions so they don’t care what price the customers paid for their shares. These funds never built up much in the way of assets and typically are not profitable until they have $50M+ in assets.
Best Regards,
Vance
Hello – I just bought a position in EXIV recently and I noticed you write above that it only trades in European day trading hours. However, I’m seeing it trade (on all sites) during normal NY trading hours.
Did they change it at some point to NY trading hours? and if yes, what exactly is it trading against after the european markets close??
thanks!
I don’t think I said that they trade only on European hours, I just said that the IV price updates stop when the European markets close. IV updates are not required for the ETP to be tradeable. EXIV & EVIX trade during the usual USA trading hours. After the European markets close the EXIV market makers are just having to guess where the “right” price is. I suspect the bid/ask spreads may get wider when the VXSTOXX futures stop trading.
Vance- Do you know what people in europe have principally been using to trade volatility (aside from vol futures directly) for the past few years?
Hi EC, Sorry, I don’t have any insights on the European volatillity funds. I know they exist but that’s about all.
Best Regards, Vance
Vance- Do you know if there are european denominated etf’s that function as the VXX/UVXY/XIV/SVXY counterparts for european based investors/traders? Given worldwide low volatility across all asset classes, I am wondering what people there have been using to trade volatility (aside from using volatility futures directly). Thanks for the help.
Hi Vance,
I tried to trade EVIX with my account in brokerage firm IB but it doesn’t allow me to trade because of I am not an US citizen (told by the customer service of IB). Do you know how can I trade European volatility? May be there are some popular European volatility etf in Europe? Or I better trade future? Please advice and thanks.
Thank you, Vance. Very good as usual.
One question, the VIX biggest one day spike is open to close or intraday?
The number I gave was previous close to close.
Vance
Vance do you suspect EXIV will outperform XIV over the next 5+ years. Does volatility and PE levels inversely correlate in your studies? It seems Europe would be more likely to have a sustained sideways to bullish run based on its current lower valuations. Then again I’m sure if such a product was around for Japan’s bull run in the 80s then inverse vol products likely would have reached multiples in the 100s. as the Japanese bull kept going into CAPE 40-80 territory.