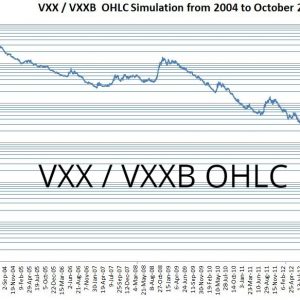
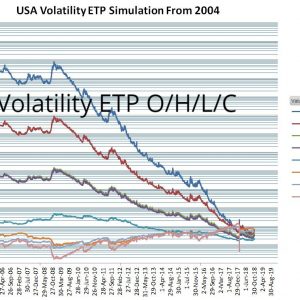
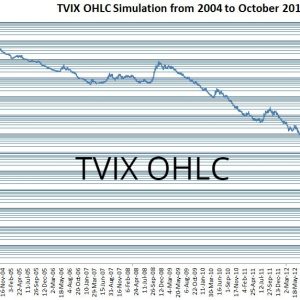
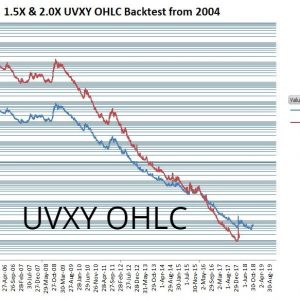
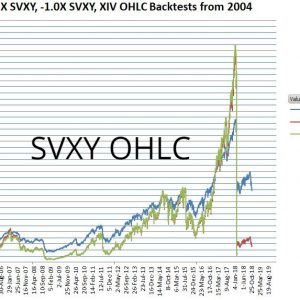
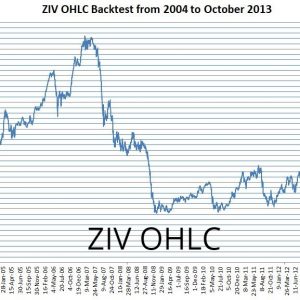
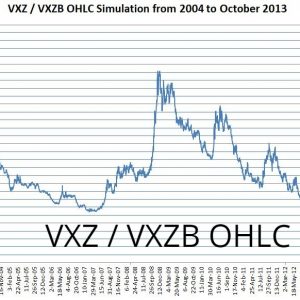
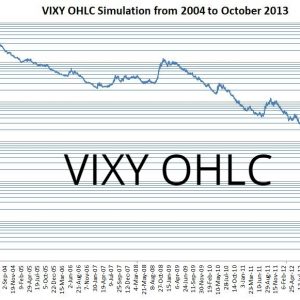
Previously I’ve done simulations, based on VIX futures, of volatility Exchange Traded Products (ETPs) back to 2004. In these simulations, I only generated the closing values, but since then I’ve had requests for open/high/low (OHL) values. I’ve extended my backtests to generate ETP opening and intraday highs and lows for many of the short and medium-term volatility funds—specifically VXX, VIXY, TVIX, UVXY (1.5X & 2X), XIV, SVXY (-.05X & -1X) , VXZ, and ZIV, in addition to the closing values.
For VXX, VXZ, UVXY, SVXY, VIXY, TVIX, and ZIV the OHLC data covers from March 2004 through the end of the most recent quarter. See this table for specifics. XIV’s OHL only goes through August 2017 and VXZ OHL data is missing Feb 2018 through the end of 2018. XIV & VXZ had closures/disruptions that distorted/eliminated the publicly available data. I combined my March 2004 through October 2013 simulations with the formerly publicly available data (I had snapshots) to give a continuous record. My simulated data has priority if both data sets are available.
ProShare’s leverage changes on UVXY & SVXY after the events of 5-February-18 created a situation where the publicly available historical data on those funds is a mix of the new and old leverage funds. Most importantly the trade data on the 1.5X UVXY and -0.5X SVXY is only available from 28-Feb-2018 on. To address this lack I simulated 1.5X UVXY and -0.5X SVXY open/high/low/close values back to March of 2004 and included that data up through the most recent quarter. See this table for specifics. I’ve also included the OHLC data for the 2X and -1.X versions of UVXY and SVXY from March 2004 until their leverage changed on 28-February-2018.
Barclays’ shenanigans with VXX & VXZ also causes trouble with the publicly available OHLC data. When the original VXX & VXZ matured in 2019 they were replaced by VXXB and VXZB, which Barclay renamed back to VXX and VXZ after a few months. Lost in the shuffle was the public OHLC data on the first instances of VXX & VXZ. I had captured the VXX data so I’ve included it in my spreadsheets. Unfortunately, I don’t have the OHL data for the original VXZ product during much of 2018.
The volatility ETPs (complete list of USA funds) are all based on two or more sets of VIX futures. The CBOE provides historical open/high/low/close/settlement values for these futures starting in March 2004. Since the indicative values (IV) of the volatility ETPs are directly tied to these futures, the futures’ opening values can be used to accurately compute the ETP’s opening values—as long as the VIX futures and ETPs start trading at the same time of day. This was the case until December 10th, 2010 when the CBOE starting shifting the opening times of VIX futures—more on this later.
The ETP intraday high/low values can also be calculated using the appropriate VIX futures intraday values but one additional assumption must be made—that the futures hit their intraday highs and lows at the same time. I didn’t expect that assumption to introduce a huge amount of error with the simulated values, but I wanted to verify that by comparing my simulation results to actual data.
To evaluate the magnitude of these errors I used O/H/L indicative value data from Barclays’ VXX short term volatility fund from June 1st, 2012 through July 16th, 2012. I would have preferred pre-December 2010 data, but I don’t have access to intraday IV data that goes that far back. A chart showing the relative percentage error is shown below.
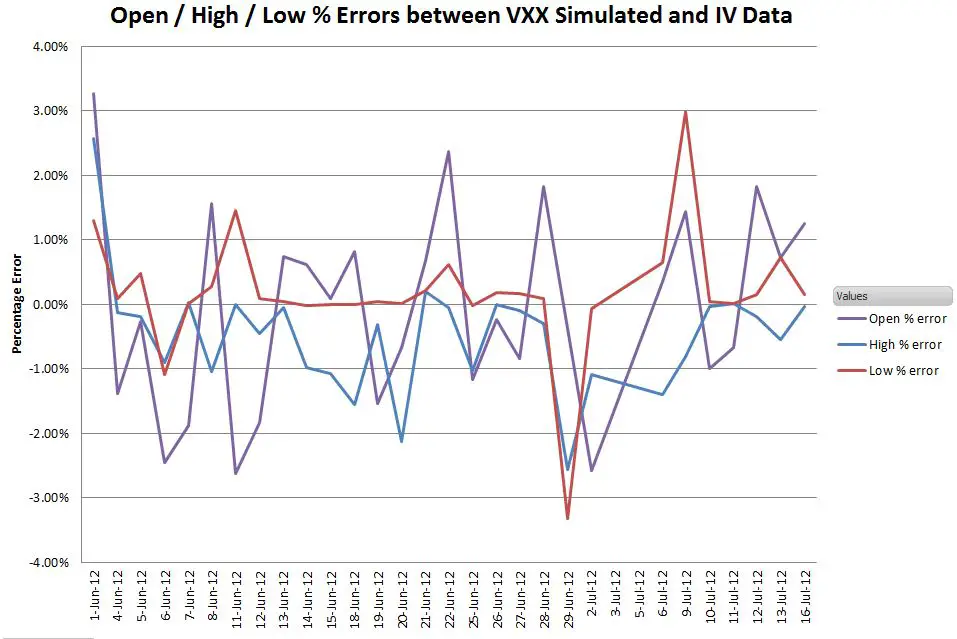
Considering the uncertainties, worst cases errors in the +-3% range seem reasonable. Sixty-five percent of the data points had errors less than 1%. Six values had errors less than 0.01%, which suggests to me that my methodology is correct.
The next chart shows the differences between the actual trades (not the IV values) and simulated O/H/L values for VXX, starting January 30, 2009.
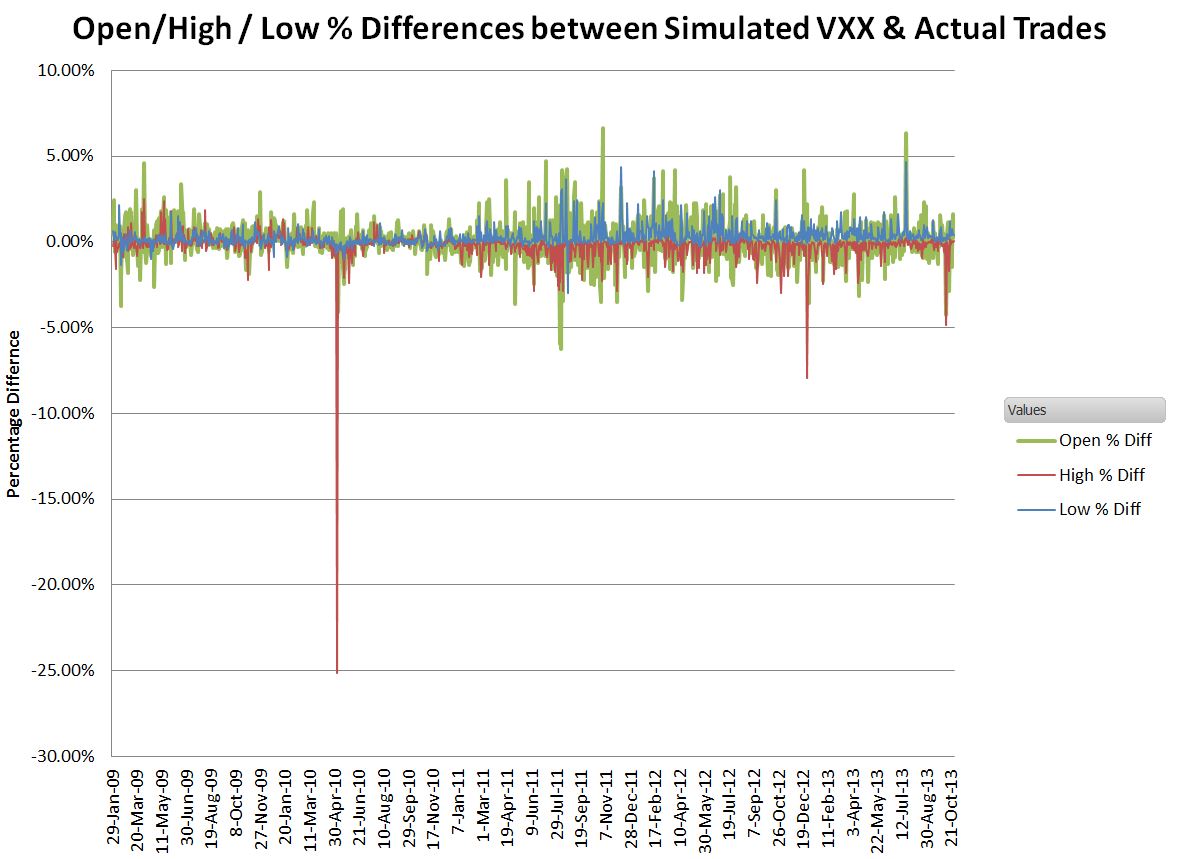
This chart illustrates a couple of additional difference terms that emerge when comparing the IV values to real trade data. First of all, there’s no guarantee that a trade will occur coincident with the open, close, or intraday highs/lows of the ETP’s IV. For example, the big -25% dip for the highs occurred on 6-May-2010—the Flash Crash. It’s not surprising that no one traded at the indicative intraday high of 42.13 (open was at 23.34!).
Other differences come from bid/ask spreads and tracking errors. The indicative value is computed from real-time VIX futures values and updated every 15 seconds, but volatility fund market makers are not obliged to trade at that value. Unless the fund is heavily traded the spread between the bid and ask price will be at least several cents and if demand is unbalanced on the buy or sell-side the offered spread values may be significantly different from the IV value.
This next chart zooms into the +-5% portion of the chart.
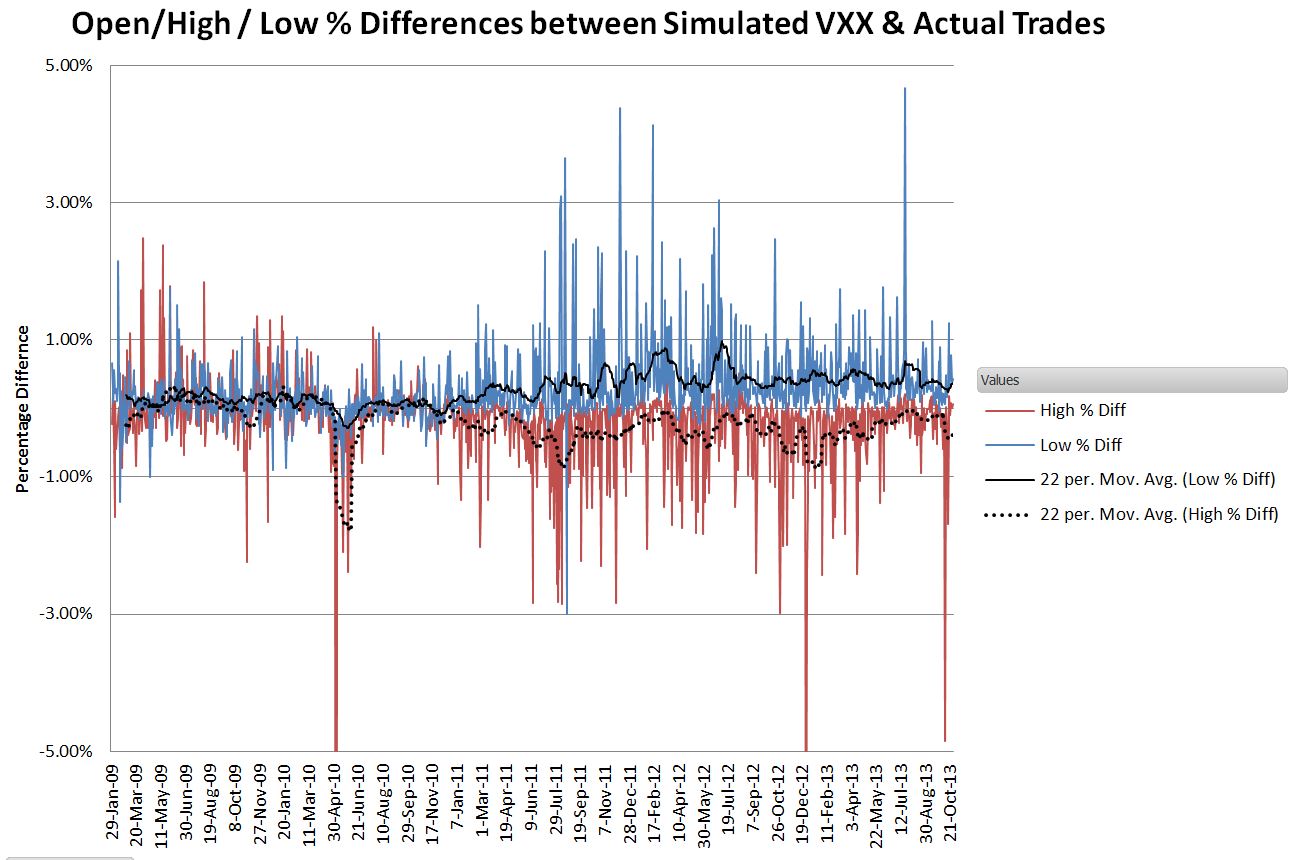
The 22 trading day moving averages show the impact of the CBOE’s shift in the open time starting in December 2010—the average difference between the simulated IV values and trade data moves from close to zero to somewhere between +-0.5% and +-1.0%.
I cut off the O/H/L simulation on the 25th of October, 2013 because on the 28th the CBOE changed the Tuesday through Friday opening times to 4:30 PM the previous day. This change was in preparation for the eventual move to nearly 24-hour VIX future trading which began June 2014. This change meant that the VIX futures were trading many hours before the volatility ETPs began trading—making VIX futures an unreliable proxy for ETP open/high/low levels. The close time, 4:15 PM ET, has remained consistent, so VIX futures can still be used to compute ETP closing values.
I verified with the CBOE that the historic VIX futures data published on its website tracks the shifted opening times and is no longer synchronized with the ETP trading times. In the case of my simulations, there’s really no harm, because their primary value lies in predicting what the ETP’s O/H/L values would have been from March 29th 2004 until the various volatility funds started trading. Actual trade O/H/L values exist for short term volatility ETP types (1X, 2X, -1X) prior to the 10-Dec-2010 shift in VIX trading hours.
The Spreadsheet
For more information on my ETP O/H/L/C simulation spreadsheet see this readme. The spreadsheet includes the formulas that convert from various indexes (e.g., similar to SPVXSTR, etc.) to the IV values, but it does not include the VIX futures values or the index calculation formulas.
If you purchase the spreadsheet you will be directed to PayPal where you can pay via your PayPal account or a credit card. Please email me at [email protected] if you have problems, questions, or requests.
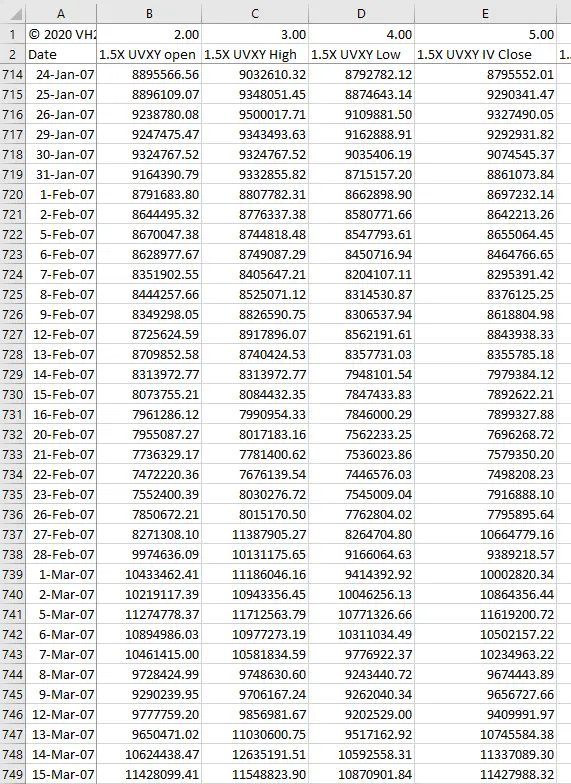
A sample of the UVXY worksheet showing the O/H/L/C data is shown below:
-
VXX O/H/L/C Backtest
$59.00 Add to cart -
Volatility ETP O/H/L/C Backtests
$199.00 Add to cart -
TVIX O/H/L/C Backtest
$59.00 Add to cart -
UVXY O/H/L/C Backtests
$59.00 Add to cart -
SVXY O/H/L/C Backtests
$59.00 Add to cart -
ZIV O/H/L/C Backtest
$59.00 Add to cart -
VXZ O/H/L/C Backtest
$59.00 Add to cart -
VIXY O/H/L/C Backtest
$59.00 Add to cart
Do you have any idea how much of the open interest and trading volume of front two months VIX futures is attributable to ETPs? Maybe variation in this is useful information?
Hi Doug, I haven’t looked at this recently, but I’d guess ~70% of the open interest / volume is driven by the Vol ETPs. The VIX futures OI has dropped quite a bit in the last couple years and so have the assets in the vol ETP overall. One of the challenges/attractions of the volatility space is that it is always shifting, figuring out why is tough. Recently it seems that the premiums of the VX futures over spot VIX have been dropping, I think this might be due to institutional arbitrage using short term SPX options, but this stuff is highly confidential, so it’s tough to get any sort of confirmation on it. Best Regards, Vance
Hi Vance, many etns I’ve seen in their prospectus have a chart/ small box excel sheet. It outlines how you can lose money by the product staying the same price or going in opposite direction. What exactly is the prospectus talking about?
I would need a page number of a specific prospectus to be sure, but my guess is that they’re talking about their relationship to the Cboe’s VIX index and/or the general equities market (e.g, S&P 500). The VIX futures that these ETNs use do not have fixed correlations to the VIX or the S&P 500, so it is not unusual to see the volatility ETNs going a different direction than usual with respect to these other indexes / products.
— Vance
Hey Vance, I’m wondering if you have ever come across November 15, 2007 in your backtests? The CBOE data shows M2 “low” spiked down to 18, but the M1 “low” did not have a similar spike down. Seems strange that they both wouldn’t have spiked down together. I’m guessing just some sort of anomaly in the data. Cheers!
Hi Gavin, Yes, obviously a bad data point. I use 25.1 as the low for M2 that day. I came up with that by using the same percentage down from open (-1.38%) as the M1 low was from its open.